
Plotting a Piecewise Function with Linear Segments
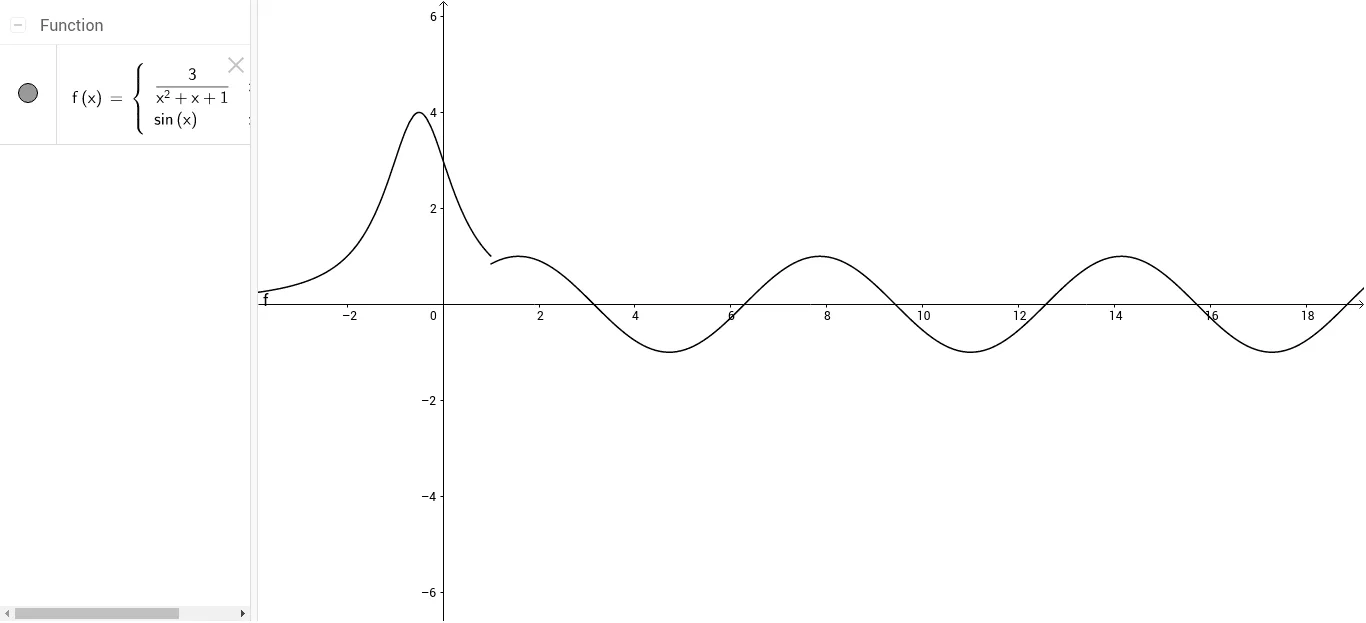
This example demonstrates how to construct and visualize a piecewise function in a single coordinate plane, highlighting how changing the formula by interval affects the resulting graph and its segment-wise connection. Key concepts include the definition of piecewise functions, linear function behavior on different subdomains, the role of algebraic operations such as fractions and subtraction in determining function values, and the mapping between coordinates and function graphs. In GeoGebra, the construction centers on creating the function object f (as indicated by the construction summary: object: f), then defining the function expressions for their respective intervals and plotting/overlaying these parts so the full piecewise graph appears together. Suitable for secondary school students learning functions and algebra, as well as for classroom demonstrations and graphing practice.
Loading the math board and drawing, please wait…