
Plotting Function Graphs by Point Plotting: Linear Function Example
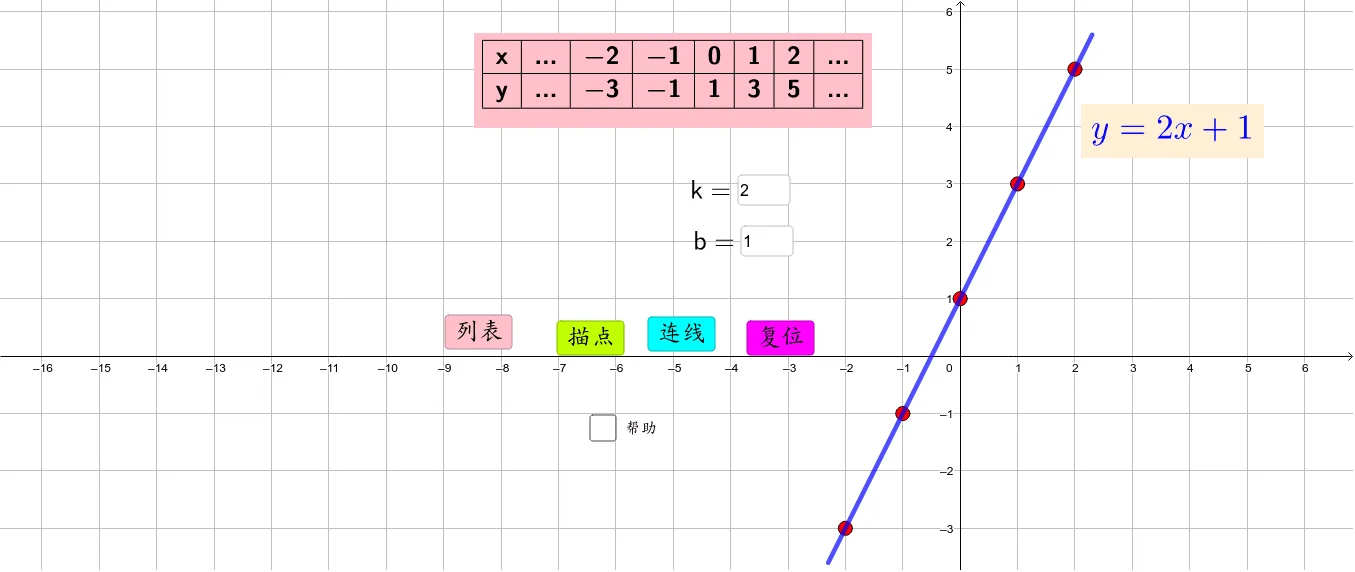
This GeoGebra applet demonstrates how to plot function graphs using the point-plotting method, taking linear functions as a detailed example. Users can adjust the parameters k and b through input boxes, and the applet automatically generates coordinate points using table and sequence commands, then plots and connects them on the coordinate plane. This interactive tool helps students intuitively understand the process of graph generation and master the basic drawing steps of making a table, plotting points, and connecting lines, making it an excellent reference tool for learning how to draw function graphs.
Loading the math board and drawing, please wait…