
Phantom Graphs for Ax^2+Bx+C
Loading the math board and drawing, please wait…
In collections
Phantom Graphs
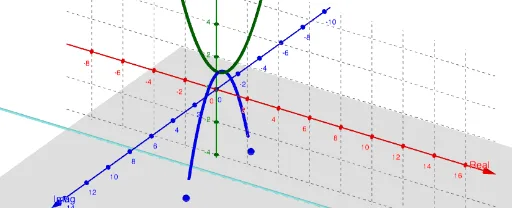
This example demonstrates the phantom graph phenomenon of the quadratic function Ax^2+Bx+C using GeoGebra. It highlights the relationship between function graphs and geometric shapes. Key mathematical concepts include quadratic functions, parabolas, loci, and coordinate geometry. Construction involves commands like ComplexRoot, Plane, CurveCartesian, and objects such as A, B, C, c, f, g, z_1, z_2. Suitable for high school students learning quadratic functions or for geometric construction teaching.
GeoGebra Commands & Parameters
ComplexRoot(f(x) - c) → z_1, z_2Plane((0, c, 0), (1, c, 1), (-1, c, 0)) → bCurveCartesian(((-B)) / ((2 * A)), ((-B^(2))) / ((4 * A)) + C - (A * t^(2)), t, t, -15, 25) → a
AI Drawing Prompt Reference
Draw a 3D coordinate system showing a quadratic function's graph and its 'phantom' complex roots. In the coordinate plane, sketch an upward-opening parabola with its vertex at a position determined by coefficients. Below the parabola, place an inclined plane that passes through the parabola's intersection with the vertical axis and extends sideways. Above the plane, mark two points representing the complex roots of the quadratic equation, located on the intersection line of the plane with a vertical plane. Overall, display the spatial relationship among the function curve, the plane, and the root points, emphasizing the correspondence between geometric construction and algebraic solutions.
The prompt above was compiled from the original drawing commands and is for reference only.