
Parabola Coefficient Exploration
Loading the math board and drawing, please wait…
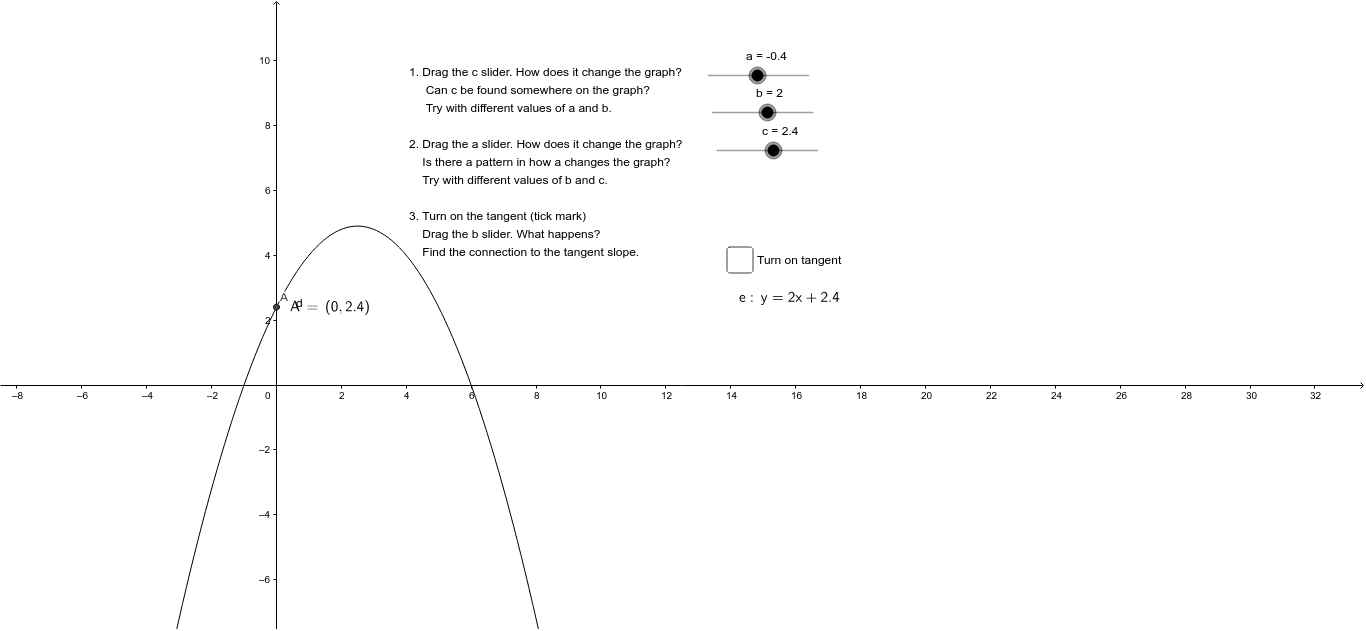
This example demonstrates the impact of coefficients a, b, and c on the shape of a parabola in the quadratic function f(x)=ax^2+bx+c. Key math concepts include quadratic function graphs, how coefficient a controls opening direction and width, coefficient b influences the axis of symmetry, and coefficient c determines the vertex's vertical position. GeoGebra commands used are Intersect, Tangent, and LaTeX, with objects like coefficients a, b, c, and helper points A, e, f. Suitable for high school students to understand the relationship between function coefficients and graph features, and as a teaching aid for the geometric meaning of derivatives in calculus.
GeoGebra Commands & Parameters
Intersect(d, yAxis, 1) → ATangent(A, d) → e,LaTeX(A, true, true) → tekst1LaTeX(e, true, true) → tekst3
AI Drawing Prompt Reference
Create a dynamic exploration graph of a quadratic function parabola, showing how coefficients affect its shape. The graph includes a parabola whose equation is determined by three adjustable coefficients, controlling opening direction, width, axis of symmetry, and vertical position of the vertex. At the point where the parabola intersects the vertical axis, draw a tangent line passing through that point. Near the intersection, label the coordinates of the point, and beside the tangent line, label its equation. The overall graph should clearly display the parabola, tangent line, and their relationship to the coordinate axes, suitable for teaching demonstration.
The prompt above was compiled from the original drawing commands and is for reference only.