
Normal Distribution Data
Loading the math board and drawing, please wait…
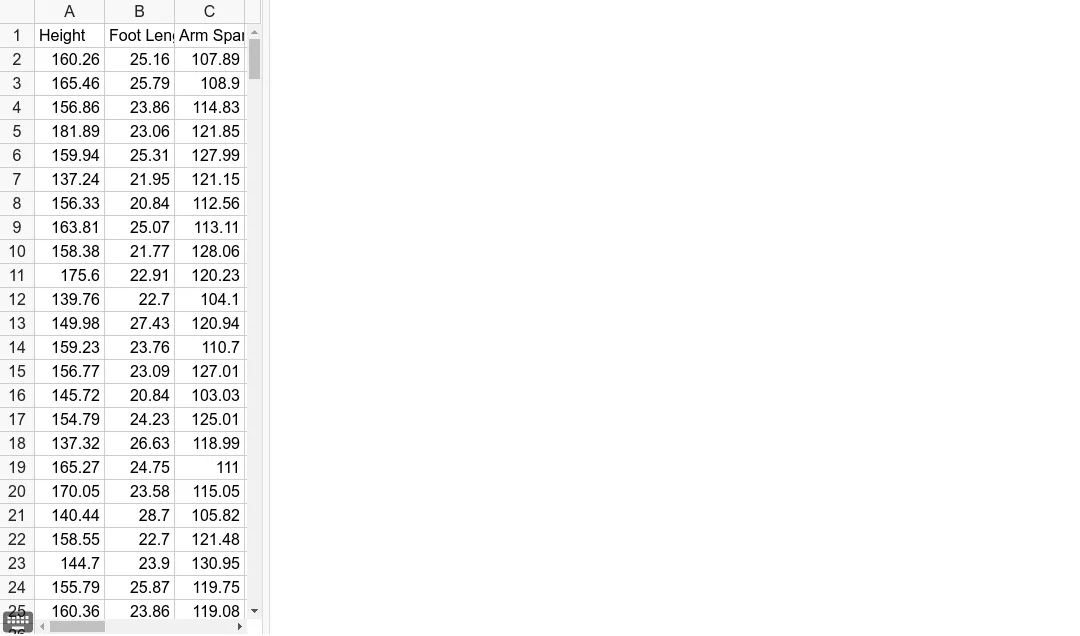
This example demonstrates normal distribution data. Normal distribution is a common probability distribution characterized by a bell-shaped curve. The example constructs multiple points to illustrate the features of normal distribution. GeoGebra commands used include point creation and movement. Suitable for high school mathematics, particularly probability and statistics courses.
GeoGebra Commands & Parameters
160.264730825.15774481107.8860939165.463496325.79236117108.9007584156.856478623.85534186114.8346733181.893028823.06262941121.8512745159.935058125.3124976127.9873179137.240567721.94738593121.1458837156.330814320.84158922112.559104163.806408625.06605704113.1055365158.375091821.77368609128.0608631175.601599322.90890272120.2340056139.755973922.69826227104.0979441149.984737427.43414689120.9437167159.22767223.76235614110.7027603156.76609423.09358255127.0067793145.720212220.84308672103.0316185154.789049524.2335622125.0090213137.323088526.62907381118.9904388165.271355624.75215211110.9966628170.052633323.57542017115.0545938140.435214228.70468733105.8177183