
Linear Regression – Least Squares Demo
Loading the math board and drawing, please wait…
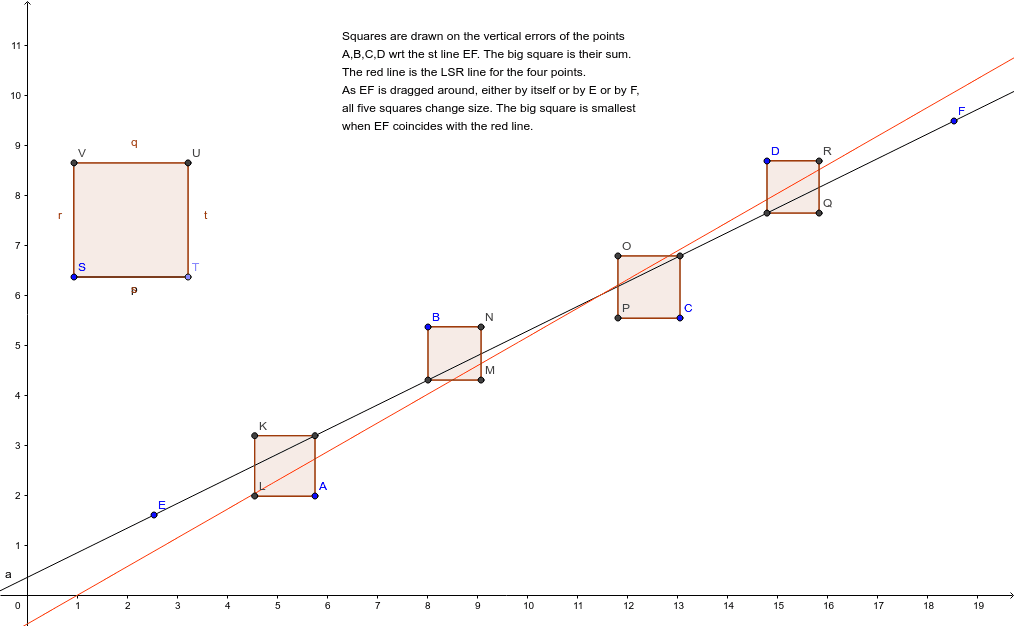
① This applet demonstrates how the least‑squares method fits a linear regression line to a set of scattered points. ② Core concepts include linear regression, the least‑squares criterion, line equations in coordinate geometry, and statistical goodness‑of‑fit. ③ Construction uses GeoGebra commands Line, OrthogonalLine, Intersect, Polygon, Point, Segment, and FitLineY, creating points A‑P, segments a‑l, and polygons poly1‑poly4; FitLineY automatically computes the regression line and draws residual perpendiculars and polygon areas. ④ Suitable for high‑school data analysis and statistics modules, introductory university statistics courses, and teacher demonstrations of the least‑squares principle.
GeoGebra Commands & Parameters
Line(E, F) → aOrthogonalLine(A, xAxis) → bOrthogonalLine(B, xAxis) → cOrthogonalLine(C, xAxis) → dOrthogonalLine(D, xAxis) → eIntersect(b, a) → GIntersect(c, a) → HIntersect(d, a) → IIntersect(e, a) → JPolygon(A, G, 4.0) → poly1, a_1, g, f, h, K, LPolygon(B, H, 4.0) → poly2, b_1, h_1, i, j, M, NPolygon(C, I, 4.0) → poly3, c_1, i_1, k, l, O, PPolygon(D, J, 4.0) → poly4, d_1, j_1, m, n, Q, RPoint(Circle[S, o]) → TSegment(S, T) → pPolygon(S, T, 4.0) → poly5, s, t, q, r, U, VFitLineY({A, B, C, D}) → e_1
AI Drawing Prompt Reference
Demonstrate the least-squares method for linear regression with a set of scattered points, fitting a regression line and drawing perpendicular residual lines from the line to each point, while showing multiple quadrilateral areas formed by the points and the regression line to illustrate the principles of linear regression and the least-squares criterion.
The prompt above was compiled from the original drawing commands and is for reference only.