
Linear Programming Application: Car Factory Production Selection
This GeoGebra applet demonstrates a high school linear programming application problem regarding car factory production choices. It guides students through the complete process of mathematical modeling and optimization for a realistic production scenario in which a factory must decide how many units of two different types of cars to manufacture given limited resources such as labor hours, steel, and production capacity.
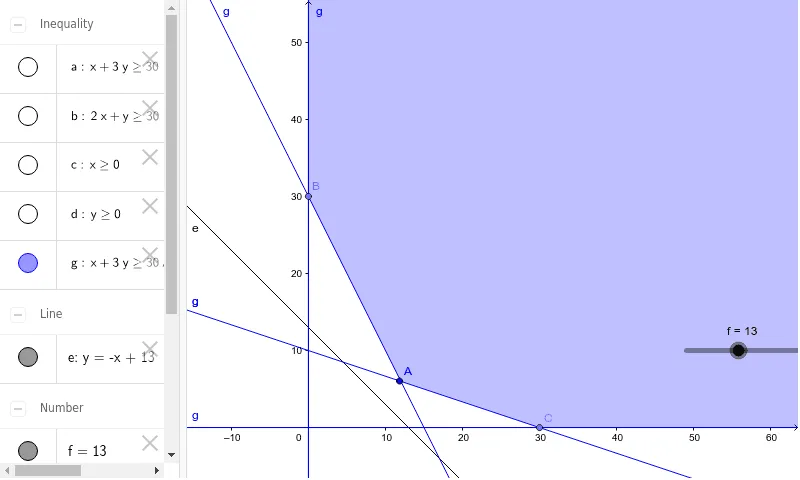
The applet begins by defining decision variables that represent the quantity of each car type to be produced. Students learn to formulate an objective function, typically representing total profit or revenue, which the factory aims to maximize. They then construct a system of linear inequalities that model the real-world constraints, including resource limits and non-negativity requirements. These constraints are plotted on a Cartesian coordinate plane, and the feasible region is shaded to show all combinations of production quantities that satisfy every constraint simultaneously.
A key feature of the applet is the visual identification of the feasible region's vertices, labeled A, B, C, and so on. The applet demonstrates the fundamental theorem of linear programming: if an optimal solution exists, it must occur at one of these corner points. Through interactive geometric methods, students can drag and translate the objective function line across the feasible region. As the line moves parallel to itself in the direction that improves the objective value, the last vertex it touches before leaving the feasible region reveals the optimal solution.
This hands-on visualization helps students connect abstract algebraic concepts with concrete geometric interpretation. They learn to evaluate the objective function at each vertex, compare the resulting values, and determine which production mix yields the maximum profit or minimum cost. The interactive nature of the applet allows students to experiment by changing the constraint parameters or the coefficients of the objective function, observing in real time how the feasible region and optimal solution shift accordingly.
This tool is particularly valuable for helping learners overcome the common difficulty of visualizing how multiple constraints interact to define a bounded solution space. By making the entire process from word problem to graphical solution transparent and interactive, the applet deepens understanding of linear programming as a powerful tool for decision-making in business, manufacturing, and everyday life.
In collections
High School Math: Grade 11, Semester 1
Loading the math board and drawing, please wait…