
Linear Equation Demo
Loading the math board and drawing, please wait…
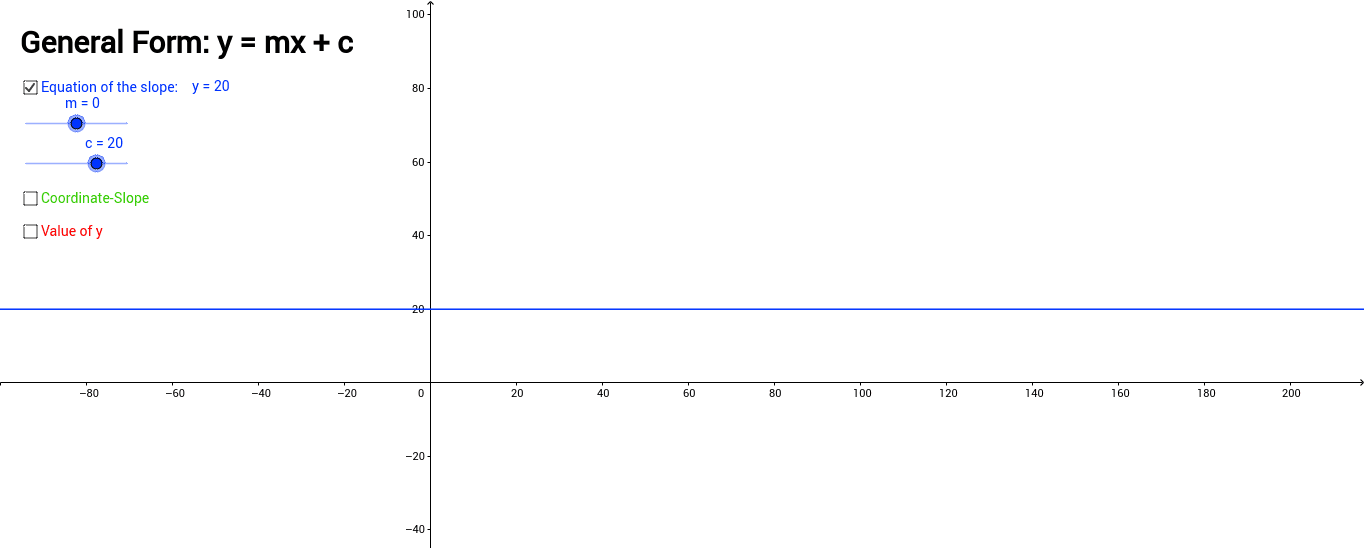
This example demonstrates the graph of a linear equation and how changes in parameters affect the line. Core math concepts include linear functions, slope (m), and y-intercept (c). Construction uses GeoGebra commands like Point and If, with objects such as m, c, c_1, P, etc. Suitable for high school mathematics education to understand the geometric meaning and parameter adjustment of linear equations.
GeoGebra Commands & Parameters
Point(c_1) → PIf(m ≠ 0, "y = " + m + "x + " + "(" + c + ")", "y = " + c) → text1
AI Drawing Prompt Reference
Draw a line representing a linear equation with adjustable slope and y-intercept using sliders. The line passes through a fixed point and is plotted on a coordinate plane. Display the equation of the line on the graph, showing the full form when the slope is non-zero and only the y-intercept when the slope is zero.
The prompt above was compiled from the original drawing commands and is for reference only.