
Limit and Tangent Line Demonstration
Loading the math board and drawing, please wait…
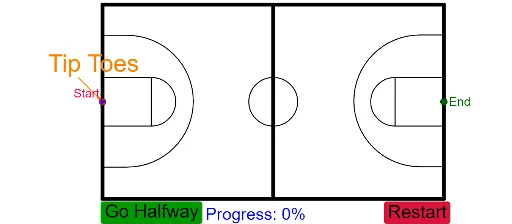
This example demonstrates the application of the limit concept in tangent line calculation by dynamically adjusting the point position to observe the tangent line changes. Key math concepts include limits, tangent lines, functions, and analytical geometry. Construction highlights involve commands like Point, Segment, Intersect, Circle, Semicircle, Vector, with critical objects such as Position, Start, D, C, c, End, g_1, Limit, A, B, a, b, d, E, F, e, G, f, H, I, g, J, K, h, L, M, i, N, O, k, P, j, Q, l, R, S, m, T, U, n. Suitable for high school and above students learning introductory calculus.
GeoGebra Commands & Parameters
Point(xAxis) → CSegment(D, C) → cPoint(c) → EndSegment(Start, End) → g_1Intersect(xAxis, yAxis) → APoint(yAxis) → BSegment(B, A) → aSegment(B, D) → bSegment(A, C) → dPoint(b) → EPoint(d) → FSegment(E, F) → ePoint(e) → GCircle(G, 0.5) → fSemicircle(H, I) → gPoint(a) → JPoint(g) → KSegment(J, K) → hPoint(a) → LPoint(g) → MSegment(L, M) → iSemicircle(O, N) → kPoint(c) → PSegment(N, P) → jPoint(c) → QSegment(O, Q) → lIntersect(g, h, 1) → RIntersect(g, i, 1) → SSegment(R, S) → mIntersect(k, j, 1) → TIntersect(k, l, 1) → USegment(T, U) → nPoint(c) → ZPoint(c) → A_1Point(a) → B_1Point(a) → D_1Semicircle(F_1, G_1) → pPoint(c) → H_1Segment(G_1, H_1) → qPoint(c) → I_1Segment(F_1, I_1) → rSemicircle(J_1, K_1) → sPoint(a) → L_1Point(a) → M_1Point(s) → O_1Point(a) → P_1Segment(O_1, P_1) → tPoint(s) → Q_1Point(yAxis) → R_1Segment(Q_1, R_1) → a_1Intersect(a, h) → N_1Intersect(c, j) → S_1Vector(T_1, TipOfToe) → u
AI Drawing Prompt Reference
Draw a function graph and dynamically adjust the position of a point to observe the changes in the tangent line. Start by creating point C on the x-axis, then create a line segment c from point C to point D. Next, create the endpoint of line segment c, and continue to create points A and B on the x-axis and the line segments a, b, and d between them. Through these points and line segments, gradually build circles, semicircles, and tangents, ultimately showing how the tangent line g_1 changes as point C moves along the x-axis.
The prompt above was compiled from the original drawing commands and is for reference only.