
Investigating Logarithmic Function Transformations
Loading the math board and drawing, please wait…
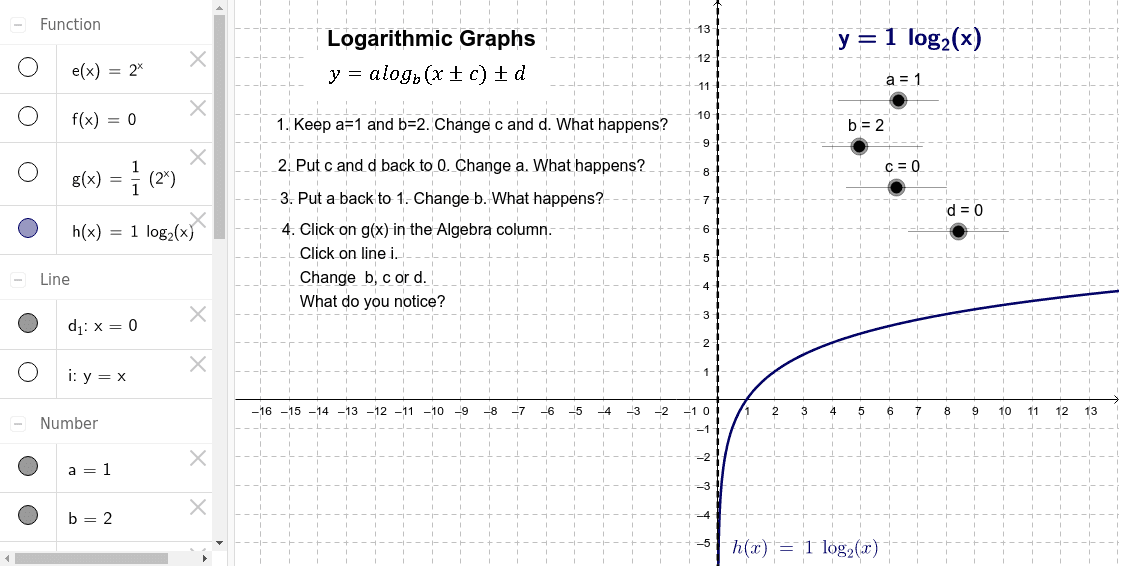
This example uses slider animation to allow students to investigate transformations of logarithmic functions and compare them with exponential functions. Key mathematical concepts include logarithmic functions, real numbers, and function graph transformations. GeoGebra commands used include sliders, text, and function graphs. Suitable for high school mathematics education and learning.
GeoGebra Commands & Parameters
Numeric a(1.0)Numeric d(0.0)Numeric c(0.0)Numeric b(2.0)h(x) = a * log(b, x + c) + de(x) = 2^(x)f(x) = dx = -cg(x) = 1 / a * (b^(x + c) + d)y = x + c + d
AI Drawing Prompt Reference
Draw a coordinate plane with a logarithmic curve whose base and transformations (vertical shift, horizontal shift, vertical stretch) are adjustable via sliders. Include an exponential curve for comparison, a horizontal asymptote, a vertical asymptote, and a straight line representing the inverse relationship. Add text labels for the function expressions. The graph should illustrate the symmetry between the logarithmic and exponential functions.
The prompt above was compiled from the original drawing commands and is for reference only.