
Investigating Cubic Graphs of the Form y = a(x+b)^3 + c
Loading the math board and drawing, please wait…
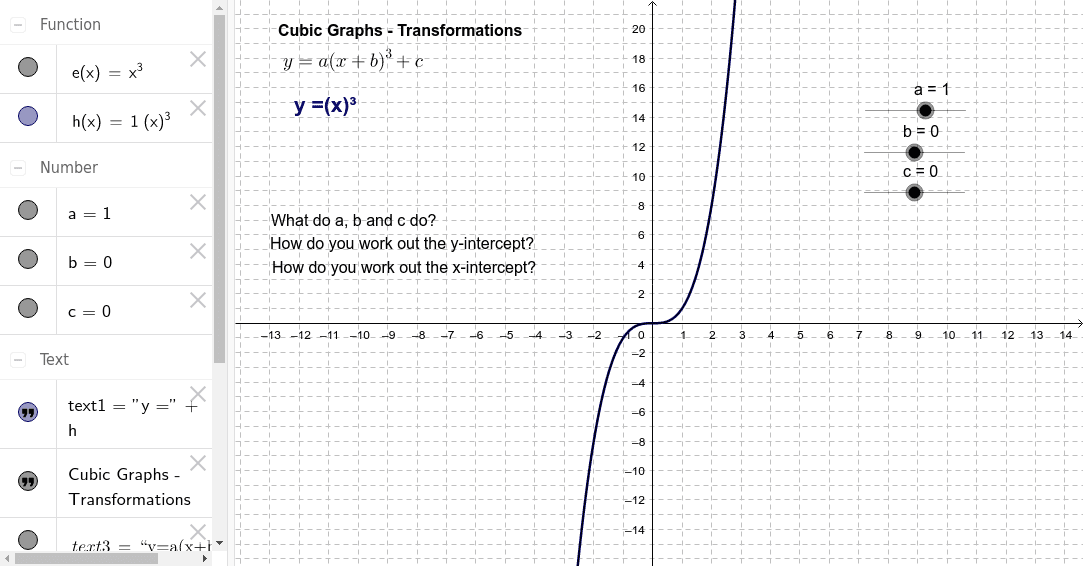
This interactive GeoGebra worksheet allows students to explore cubic functions of the form y = a(x+b)^3 + c by using sliders to adjust parameters a, b, and c. It demonstrates how changes in these parameters affect the graph's vertical stretch/compression, horizontal shift, and vertical translation, as well as the location of the inflection point. The construction uses sliders for a, b, and c, along with text objects (text1 to text6) to display the current function expression and relevant coordinates. This resource is ideal for high school students learning about transformations of polynomial functions, and for teachers demonstrating the relationship between algebraic parameters and graphical behavior in a dynamic, inquiry-based setting.
GeoGebra Commands & Parameters
Numeric a(1.0)Numeric b(0.0)Numeric c(0.0)h(x) = a * (x + b)^(3) + ce(x) = x^(3)
AI Drawing Prompt Reference
Create a graph with three sliders to adjust parameters a, b, and c, and display the function y=a(x+b)^3+c. As the parameters change, the graph should show vertical stretch/compression, horizontal shift, and vertical translation. Also, label the current function expression and key coordinates, especially the inflection point, in the graph. Start with the base function y=x^3 as a reference, then dynamically adjust the target function's graph based on the slider values.
The prompt above was compiled from the original drawing commands and is for reference only.