
Introduction to Sine Function
Loading the math board and drawing, please wait…
In collections
PDGE Year 1: Making Use of ICT Resources
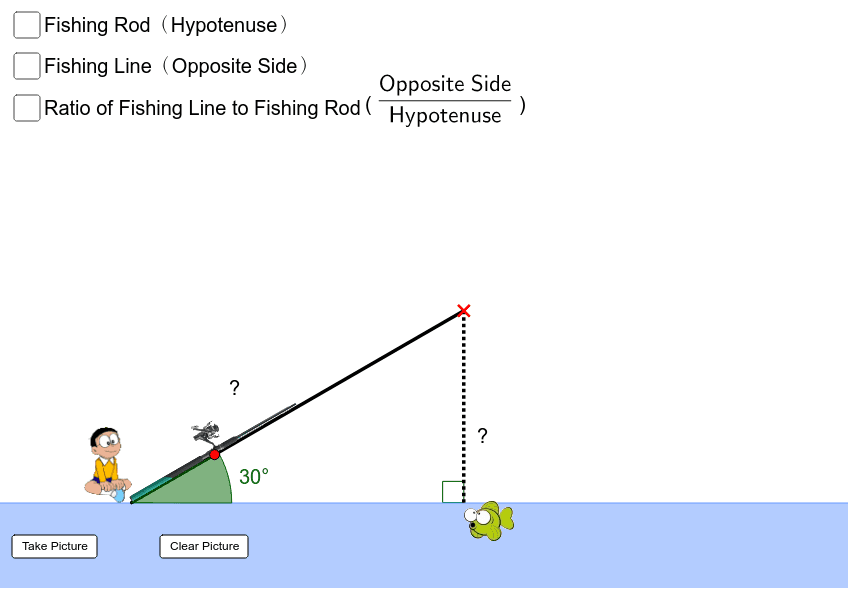
This example dynamically demonstrates the sine function graph to help students understand the basic properties of the sine function. It involves core trigonometry concepts and is constructed using GeoGebra commands such as Point, Ray, and Segment. Suitable for students from middle school and above to learn about the sine function and its graph.
GeoGebra Commands & Parameters
Point(Sequence[(0.5 * cos(i°), 0.5 * sin(i°)), i, 0, 90]) → RRay(2 * R, 3 * R) → rayPoint(ray) → PSegment(O, P) → rodSegment(P, Q) → stringAngle(Q, O, P) → αAngle(P, Q, O) → βSegment(O, P') → rod'Segment(P', Q') → string'Angle(P', Q', O) → γAngle(Q', O, P') → δ
AI Drawing Prompt Reference
Draw a dynamic graph of the sine function, featuring a ray starting from the origin and a point moving along the first quadrant, with the line connecting the point to the origin representing the sine value and the angle formed by the ray and the point demonstrating the geometric meaning of the sine function. Show the sine function's graph and properties through the dynamic movement of the point.
The prompt above was compiled from the original drawing commands and is for reference only.