
Interactive Pie Chart: Drag Sliders to Change Group Frequencies
Loading the math board and drawing, please wait…
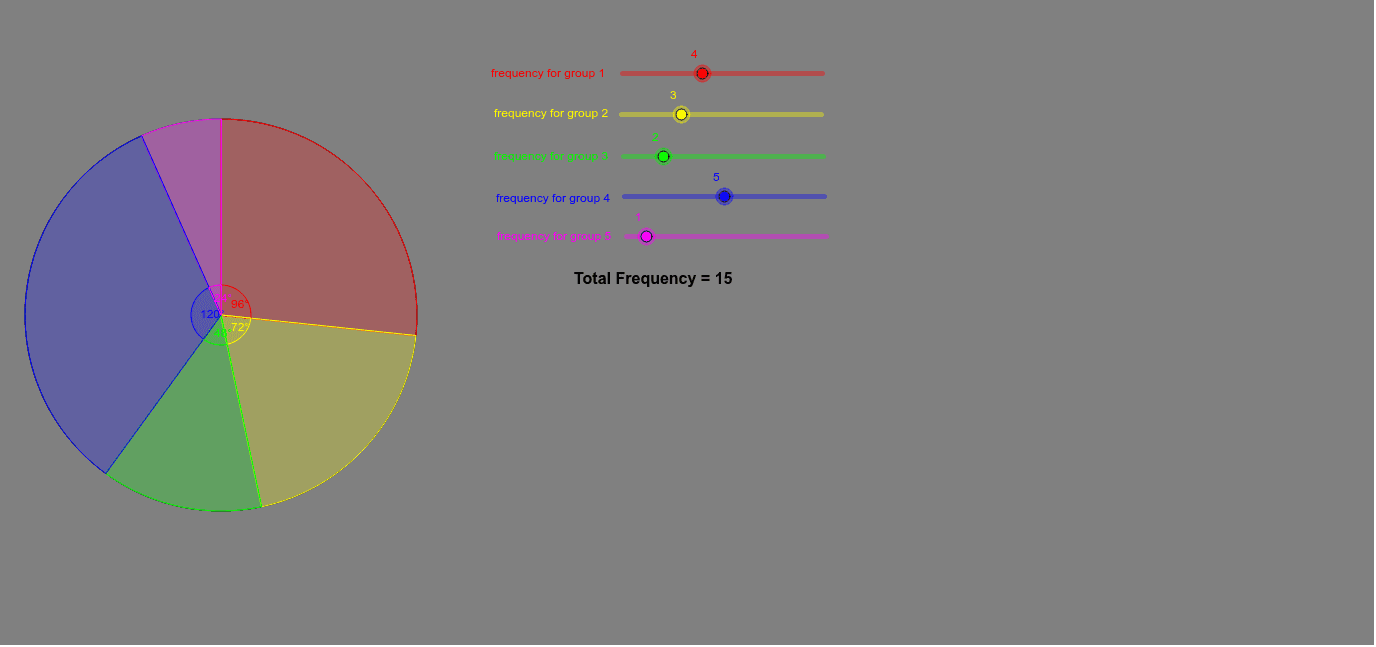
① This example demonstrates an interactive pie chart where users drag sliders to adjust the frequencies of different groups, and the sector sizes update in real time. ② Core mathematical concepts include proportions, angles, and the relationship between sector area and frequency, as well as statistical representation of grouped data. ③ Construction details: The pie chart is built using GeoGebra commands such as Circle, CircleSector, Rotate, Angle, Intersect, and Point; sliders control frequency parameters, while text objects (texte1–texte6) display labels; auxiliary points (C', C'', C''') and angle variables (α, β, γ, δ, ε) are used to precisely partition the circle into sectors. ④ Suitable for middle school or introductory statistics lessons, this tool helps students intuitively grasp the conversion between frequencies, proportions, and angles, and supports exploratory learning in data visualization.
GeoGebra Commands & Parameters
Intersect(xAxis, yAxis) → APoint(xAxis) → BCircle(A, B) → cIntersect(c, yAxis, 2) → CRotate(C, ((-((a * 360 / t))))°, A) → C'Angle(C', A, C) → αRotate(C', ((-((b * 360 / t))))°, A) → C''Rotate(C'', ((-((d * 360 / t))))°, A) → C'''Rotate(C''', ((-((e * 360 / t))))°, A) → DAngle(C'', A, C') → βAngle(C''', A, C'') → γAngle(D, A, C''') → δAngle(C, A, D) → εCircleSector(A, C', C) → gCircleSector(A, C'', C') → hCircleSector(A, C, D) → kCircleSector(A, C''', C'') → pCircleSector(A, D, C''') → q
AI Drawing Prompt Reference
Draw an interactive pie chart with its center at the origin and a starting point on the positive x-axis. Five sliders control the frequencies of five groups, each converting to an angle equal to its proportion of the total times 360 degrees. Starting from the initial point, rotate clockwise by these angles sequentially to create five boundary points, then connect the center to each boundary point, dividing the circle into five sectors. Fill each sector with a distinct color and label it with the group name or frequency. All angles and sector sizes update in real time as sliders are dragged, showing the relationship between frequency and angle.
The prompt above was compiled from the original drawing commands and is for reference only.