
Interactive Data Averages Visualization
Loading the math board and drawing, please wait…
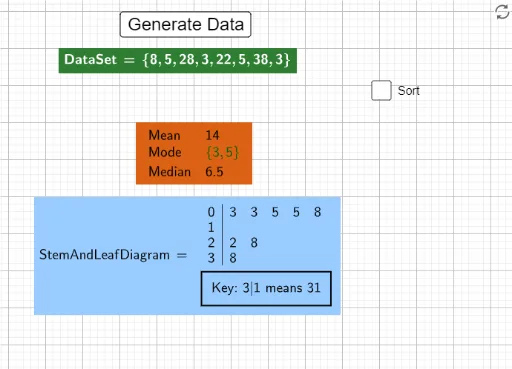
This example demonstrates data average calculations through interactive scatter plots, covering statistical concepts like mean, median, and mode. Construction involves using GeoGebra commands such as Random, mean, Median, Mode, TableText, and LaTeX to generate and analyze data. Suitable for high school statistics education or university data analysis courses.
GeoGebra Commands & Parameters
Random(-5, 15) → amean(DataSet) → bMedian(DataSet) → cMode(DataSet) → dTableText({"Mean", b}, {"Mode", d}, {"Median", c}) → text1LaTeX(DataSet, true, true) → text2Sort(DataSet) → SortedDataSetLaTeX(SortedDataSet, true, true) → text3StemPlot(DataSet) → StemAndLeafDiagramLaTeX(StemAndLeafDiagram, true, true) → text4
AI Drawing Prompt Reference
Please draw a scatter plot with random data points and display the mean, median, and mode. The graphic should include a text label showing these statistics, a LaTeX text showing the dataset, a sorted dataset, a LaTeX text showing the sorted dataset, and a stem-and-leaf plot with a LaTeX text. The construction order is: generate random data, calculate statistics, create text labels, draw LaTeX text, sort the dataset, and finally draw the stem-and-leaf plot.
The prompt above was compiled from the original drawing commands and is for reference only.