
IM 6.2.13 Practice: Tables and Double Number Line Diagrams
Loading the math board and drawing, please wait…
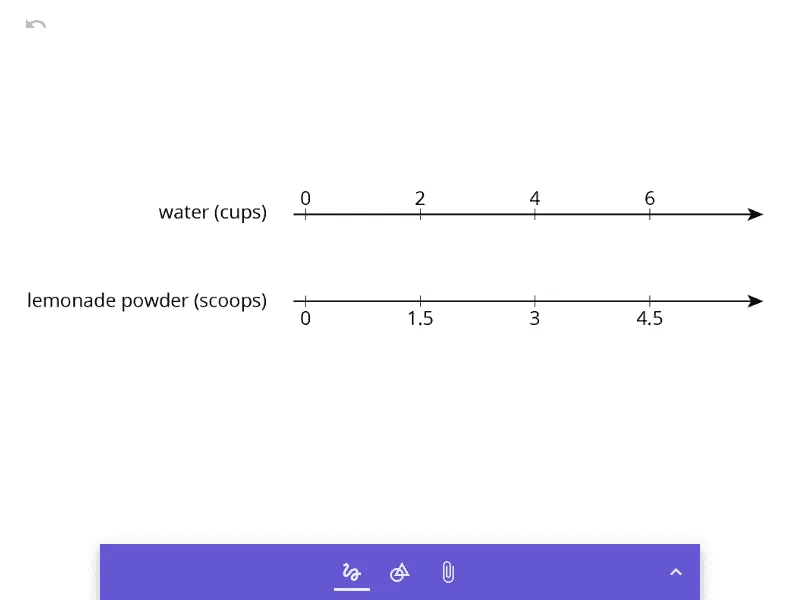
This example demonstrates how to use tables and double number line diagrams to represent proportional relationships between two quantities, allowing students to visually compare different ratios. The core mathematical concepts include proportional reasoning, unit rates, and the conversion between tabular data and number line representations. In terms of construction, the GeoGebra file includes an image object (pic1), likely used to display a static example or practice background of a double number line diagram; no complex commands are involved, focusing instead on interpreting and drawing such diagrams. This resource is suitable for upper elementary or middle school students (grades 6-7) to reinforce proportional concepts, and can serve as supplementary practice for teachers. By observing corresponding tick marks on the double number line, students grasp the meaning of equivalent scaling and learn to organize data in tables while visualizing ratios on a number line.
AI Drawing Prompt Reference
Draw a double number line diagram to represent the proportional relationship between two quantities. Include a background image to show an example of the double number line diagram. Mark corresponding tick marks on the double number line to understand the concept of equivalent scaling, and organize data in a table to visualize ratios.
The prompt above was compiled from the original drawing commands and is for reference only.