
Graphing x^n when n is not an integer
Loading the math board and drawing, please wait…
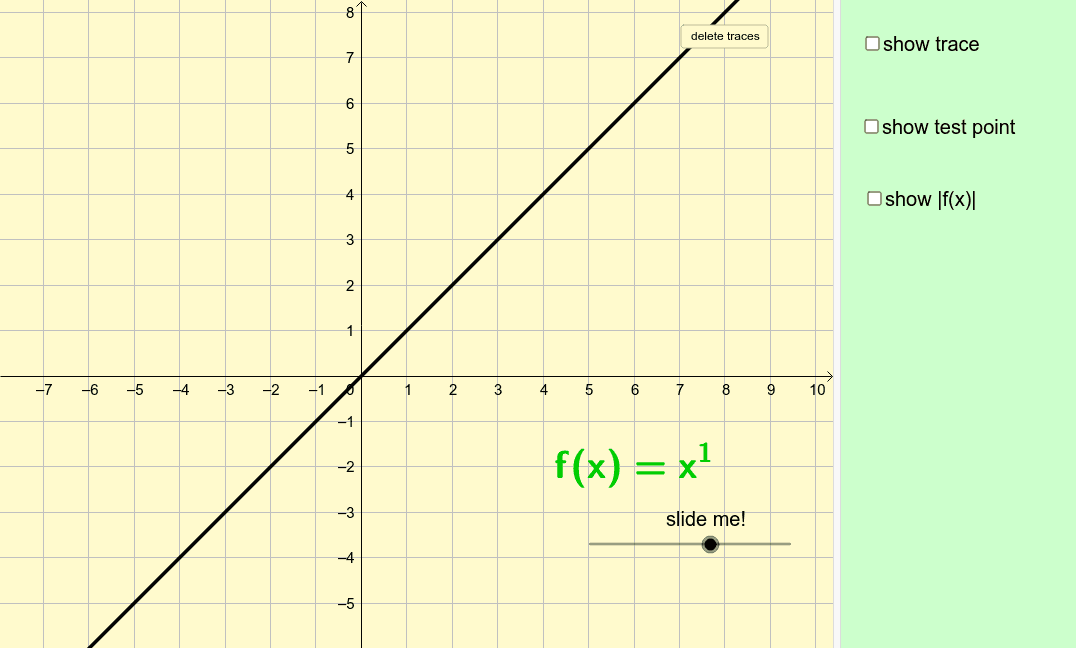
This example demonstrates the graphical behavior and properties of the function x^n when the exponent n is a non-integer. It involves core mathematical concepts such as power functions, roots, exponential operations, and trigonometric relationships. The construction utilizes GeoGebra objects like sliders (n, a), functions (f), points (A), text elements (text2, text3, text6), traces (ftrace, gtrace), and buttons (button1, g). It is suitable for high school and advanced learners to explore the geometric meaning and transformations of non-integer exponentials.
GeoGebra Commands & Parameters
Numeric n(1)f(x) = x^(n)Point A(1.18, -3.12)Boolean a(false)ftrace(x) = x^(n)gtrace(x) = x^(n)Boolean b(false)Boolean c(false)g(x) = abs(f(x))
AI Drawing Prompt Reference
Plot the function y = x^n where n is a non-integer. Adjust n using a slider to observe changes in the graph. Create point A at (1.18, -3.12) and draw the graphs of f(x) = x^n and g(x) = |x^n|. Use buttons to toggle the visibility of f and g.
The prompt above was compiled from the original drawing commands and is for reference only.