
Graphing Two Inequalities
Loading the math board and drawing, please wait…
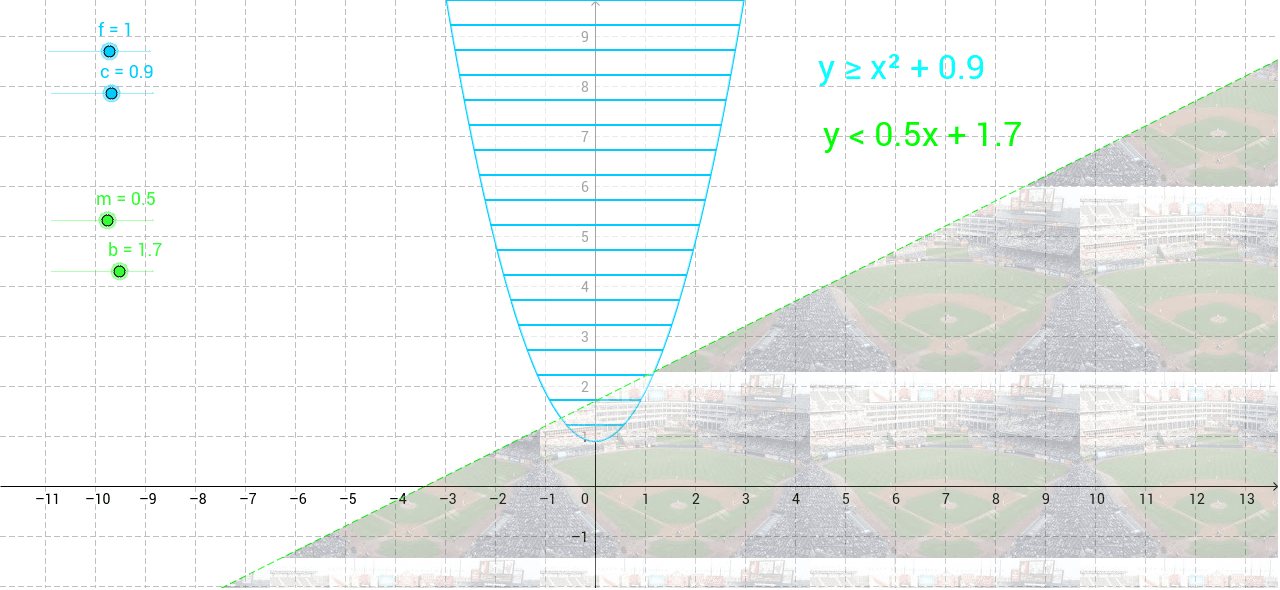
This example demonstrates how students can use sliders to dynamically adjust both linear and quadratic functions, visualizing the intersection of their solution sets for inequalities. Core math concepts include function graphing, inequality solving, linear functions, and quadratic functions. It utilizes GeoGebra commands/objects like sliders m (slope), b (intercept), f (function), c (parameter), b_1 (inequality parameter), d (text), text1, a (parameter), and text2. Suitable for high school mathematics education to understand the relationship between function graph intersections and inequality solution sets.
GeoGebra Commands & Parameters
Numeric m(0.5)Numeric b(1.7)Numeric f(1.0)Numeric c(0.9)b_1: x > 1y ≥ f * x^(2) + cy < m * x + b
AI Drawing Prompt Reference
Graph two inequalities: one is the linear inequality x > 1, and the other is the quadratic inequality y ≥ 0.9x^2 + 0.9. Also graph the linear function y = 0.5x + 1.7. Adjust the slope and intercept using sliders to observe the intersection of their solution sets.
The prompt above was compiled from the original drawing commands and is for reference only.