
Graphing the Cosine Function
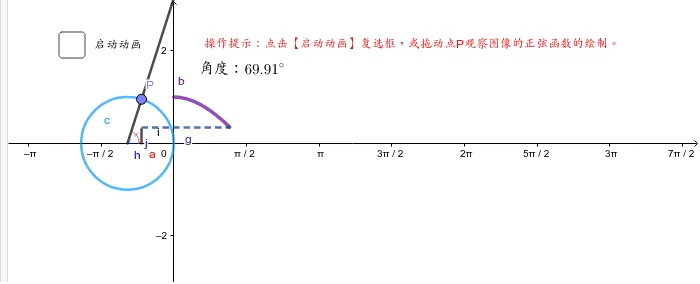
This GeoGebra applet demonstrates how to graph the cosine function. By combining geometric constructions with algebraic commands like CurveCartesian, it dynamically illustrates the variation of cosine values with respect to angles. The model visually presents the waveform characteristics of the cosine function and utilizes parameters and sliders to help users understand core concepts such as periodicity, amplitude, and phase shift. Through interactive exploration, students can manipulate sliders to adjust key parameters of the cosine function and immediately observe how each change affects the graph in real time. This hands-on approach deepens understanding of how amplitude controls the height of the wave, how the period determines the length of one complete cycle, and how phase shift moves the graph horizontally. The applet also shows the geometric relationship between the unit circle and the cosine curve, reinforcing the connection between circular motion and trigonometric waveforms. It serves as an excellent visualization tool for learning the graphs and properties of trigonometric functions.
In collections
Vocational High School Mathematics
Loading the math board and drawing, please wait…