
Graphing Tangent Functions by James McGuinness
Loading the math board and drawing, please wait…
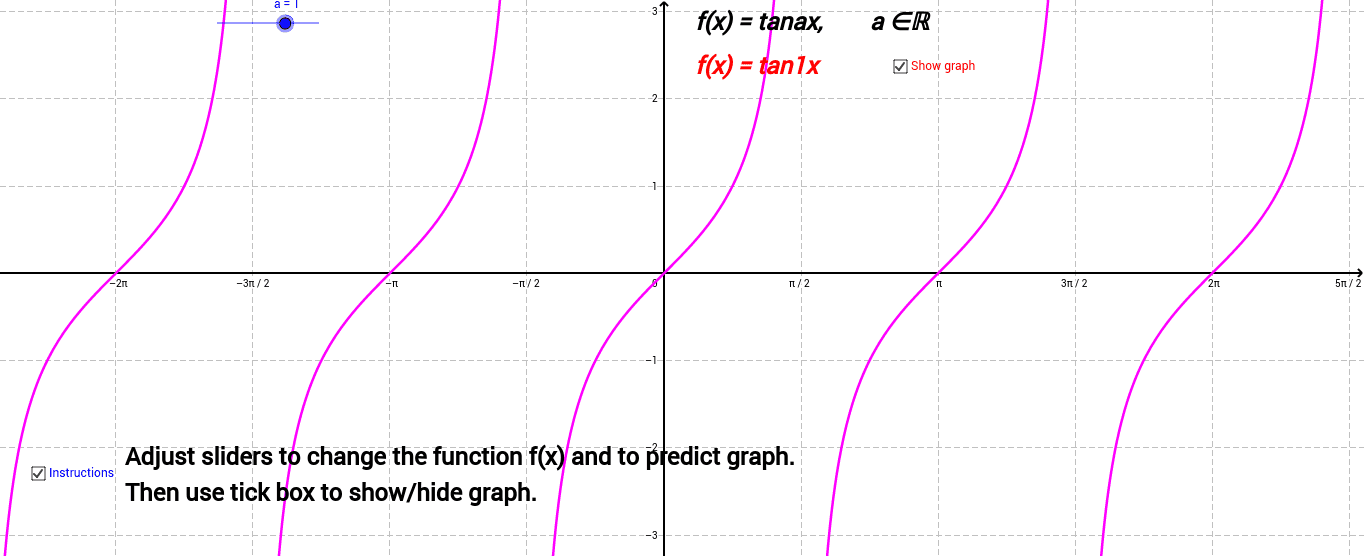
This example demonstrates the graph of the trigonometric function [math]f(x)=tanax[/math]. Key mathematical concepts include trigonometry. By adjusting parameter a, observe changes in the period and asymptotes. Utilizes GeoGebra text and function objects. Suitable for high school math education.
GeoGebra Commands & Parameters
Numeric a(1.0)Boolean d(true)Boolean e(true)f(x) = tan(a * x)
AI Drawing Prompt Reference
Draw the graph of the tangent function f(x) = tan(ax), where a is a variable parameter. Observe how changing the value of a affects the period and asymptotes of the graph. Use text and function objects for display.
The prompt above was compiled from the original drawing commands and is for reference only.