
Graphing Quadratic Inequalities by lksyck
Loading the math board and drawing, please wait…
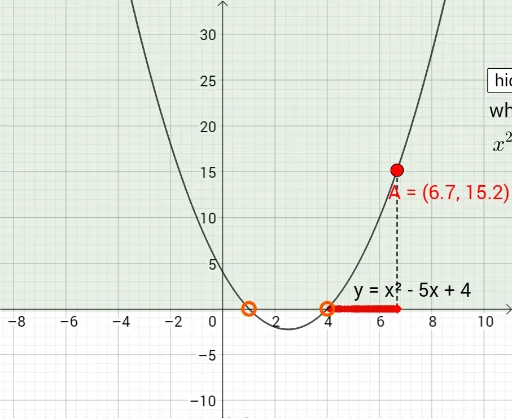
This example demonstrates the graphical representation of quadratic inequalities. Key mathematical concepts include quadratic functions and inequalities. Using GeoGebra commands such as Point, Segment, Intersect, and Polygon, the construction of the inequality graph is shown. Suitable for high school mathematics education and learning.
GeoGebra Commands & Parameters
Point(c) → APoint({x(A), 0}) → BSegment(A, B) → fIntersect(c, xAxis, 2) → CIntersect(c, xAxis, 1) → DPolygon((-1003.4530219981327, 999.6585208994013), (-1003.4530219981327, -0.3414791005986899), (996.5469780018673, -0.3414791005986899), (996.5469780018673, 999.6585208994013)) → up, g, h, i, jPolygon((-1000, -1000), (-1000, 0), (1000, 0), (1000, -1000)) → down, k, l, m, n
AI Drawing Prompt Reference
Draw a quadratic function curve and its inequality regions. First, mark the two intersection points where the parabola crosses the x-axis. Pick an arbitrary point on the parabola and draw a vertical segment from it down to the x-axis. Then create two shaded polygon areas: one above the parabola covering the entire visible plane, representing where the quadratic is positive, and another below the x-axis, representing where it is negative. Use distinct colors or transparency to clearly separate the two solution regions.
The prompt above was compiled from the original drawing commands and is for reference only.