
Graphing Linear Inequalities Practice
Loading the math board and drawing, please wait…
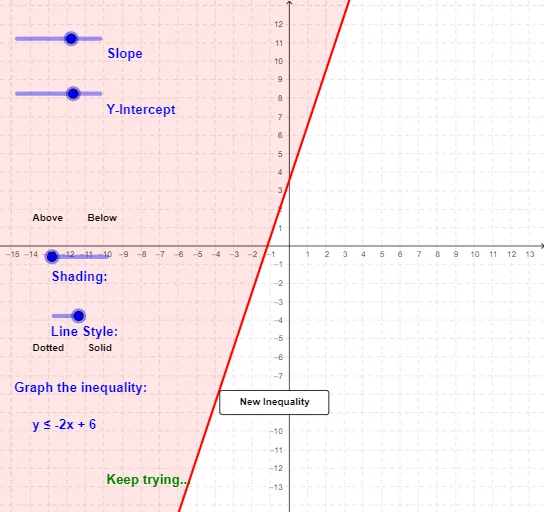
This example demonstrates how to graph linear inequalities. The core mathematical concepts involved are linear inequalities and their graphs. Using GeoGebra commands such as OrthogonalLine, Intersect, and Polygon, dynamic graphs of inequalities can be created. Suitable for middle school and above students to practice graphing inequalities.
GeoGebra Commands & Parameters
OrthogonalLine(A, xAxis) → cOrthogonalLine(B, xAxis) → dOrthogonalLine(A, yAxis) → eOrthogonalLine(B, yAxis) → gIntersect(c, g) → CIntersect(d, e) → DPolygon(A, D, B) → poly1, b_1, a_1, d_1Polygon(A, B, C) → poly2, c_1, a_2, b_2Polygon(A, A2, B2, B) → poly3, a_3, a2, b2_1, b_3Polygon(A3, B3, B, A) → poly4, a3, a4, b_4, a_4RandomElement({0, -1, 1, -2, 2, -3, 3, -4, 4, -0.5, 0.5}) → m2Random(-8, 8) → b2RandomElement({-1, 1}) → h2RandomElement({-1, 1}) → i2
AI Drawing Prompt Reference
Create a practice graph for linear inequalities. Start with two points, draw perpendicular lines from each to the x-axis and y-axis, forming intersections that create two rectangles. Then add two quadrilaterals defined by four points each, representing feasible regions. Finally, randomly generate a slope, an intercept, and two direction parameters to define a line, and use shading or colors to distinguish different regions, illustrating the solution sets of the inequalities.
The prompt above was compiled from the original drawing commands and is for reference only.