
Graphing Linear Inequalities by Joy
Loading the math board and drawing, please wait…
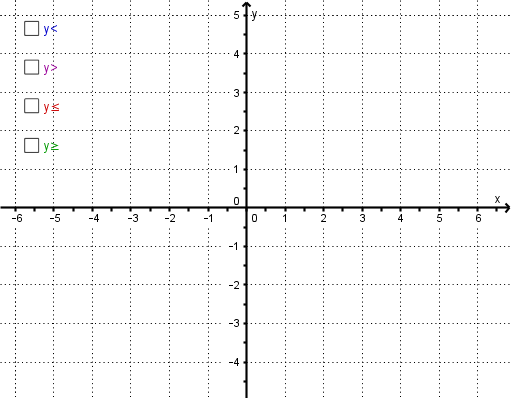
This example demonstrates graphing linear inequalities. Key mathematical concepts include inequalities and linear functions. Using GeoGebra commands like Polygon and If, the graph of the inequality is constructed. Suitable for middle school and above students to learn the graphical representation of linear inequalities.
GeoGebra Commands & Parameters
Polygon((60, f(60)), ((-60), f((-60))), 4) → poly1, c, g, k, p, A, BPolygon((60, s(60)), ((-60), s((-60))), 4) → poly2, a_2, b_5, c_1, d_1, C, DPolygon(((-60), r((-60))), (60, r(60)), 4) → poly3, e_1, f_1, g_1, h_1, E, FPolygon(((-60), t((-60))), (60, t(60)), 4) → poly4, i_1, j_1, k_1, l_1, G, HIf((A2 * x(T_1)) + B2 > y(T_1), true, false) → C2If((A3 * x(T_2)) + B3 < y(T_2), true, false) → C3If((A4 * x(T_3)) + B4 ≥ y(T_3), true, false) → C4If((A5 * x(T_4)) + B5 ≤ y(T_4), true, false) → C5