
Graphing Linear Inequalities by Eric Funke
Loading the math board and drawing, please wait…
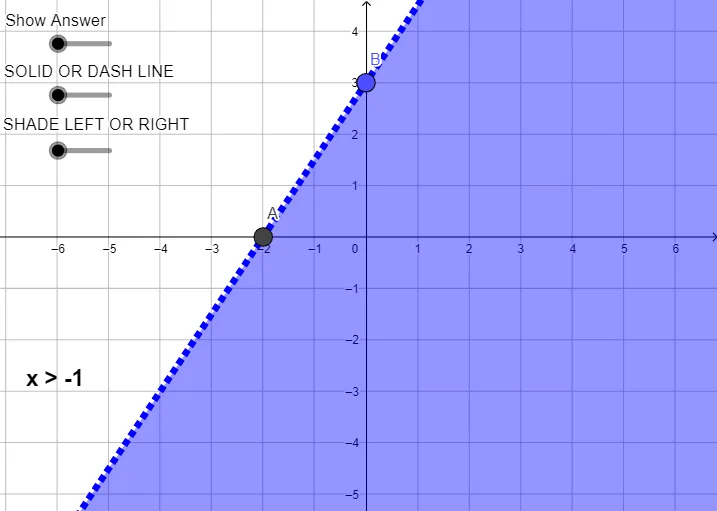
This example demonstrates how to use GeoGebra to graph linear inequalities. Key mathematical concepts include linear inequalities and linear functions. Using commands like Line and If, the boundary lines and shaded regions of the inequalities are constructed. Suitable for middle school and above students to learn the graphical representation of linear inequalities.
GeoGebra Commands & Parameters
Line(A, B) → fIf(d ≟ 0 ∧ s ≟ 0 ∧ x(B) - x(A) ≟ 0, x < x(A), d ≟ 0 ∧ s ≟ 1 ∧ x(B) - x(A) ≠ 0, y > (m * x) + b, d ≟ 1 ∧ s ≟ 0 ∧ x(B) - x(A) ≠ 0, y ≤ (m * x) + b, y ≥ (m * x) + b, d ≟ 0 ∧ s ≟ 1 ∧ x(B) - x(A) ≟ 0, x > x(A), d ≟ 1 ∧ s ≟ 0 ∧ x(B) - x(A) ≟ 0, x ≤ x(A), d ≟ 1 ∧ s ≟ 1 ∧ x(B) - x(A) ≟ 0, x ≥ x(A), d ≟ 0 ∧ s ≟ 0 ∧ x(B) - x(A) ≠ 0, y < (m * x) + b) → a
AI Drawing Prompt Reference
Draw a graph of a linear inequality. Start by plotting a straight boundary line determined by two given points. Then, based on the inequality sign (greater than, less than, greater than or equal, less than or equal) and whether the line is vertical or slanted, shade the appropriate side of the line. For slanted lines, shade above or below; for vertical lines, shade left or right. The graph should clearly show the boundary line and the shaded region representing the solution set.
The prompt above was compiled from the original drawing commands and is for reference only.