
Graphing Exponential Functions Extended Problem #1
Loading the math board and drawing, please wait…
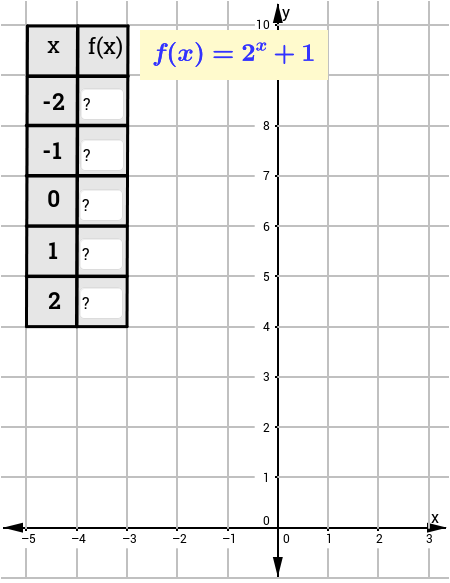
This example demonstrates how to plot exponential function graphs and check understanding. Core math concepts include exponential functions, graphing, coordinate systems, and point labeling. GeoGebra commands and objects used in construction are Segment, Textfield, Polygon, and Point. Suitable for high school mathematics teaching, focusing on graphing exponential functions and understanding their properties.
GeoGebra Commands & Parameters
Segment(F, S) → aSegment(H, T) → bSegment(T, S) → cSegment(H, F) → dSegment(I, J) → eTextfield(l) → inputBox1Textfield(n) → inputBox3Textfield(p) → inputBox5Textfield(q) → inputBox6Textfield(r) → inputBox7Polygon(G, M, N, L) → poly1, g, m_1, n_1, l_1Segment(K, O) → hSegment(P, W) → iSegment(R, F_1) → kSegment(U, G_1) → sSegment(V, H_1) → tSegment(I_1, J_1) → a_1Segment(K_1, L_1) → b_1Point(g) → M_1Segment(N_1, E_1) → d_1Segment(Q, E_1) → j