
Graphing Cubic Functions and Intersections
Loading the math board and drawing, please wait…
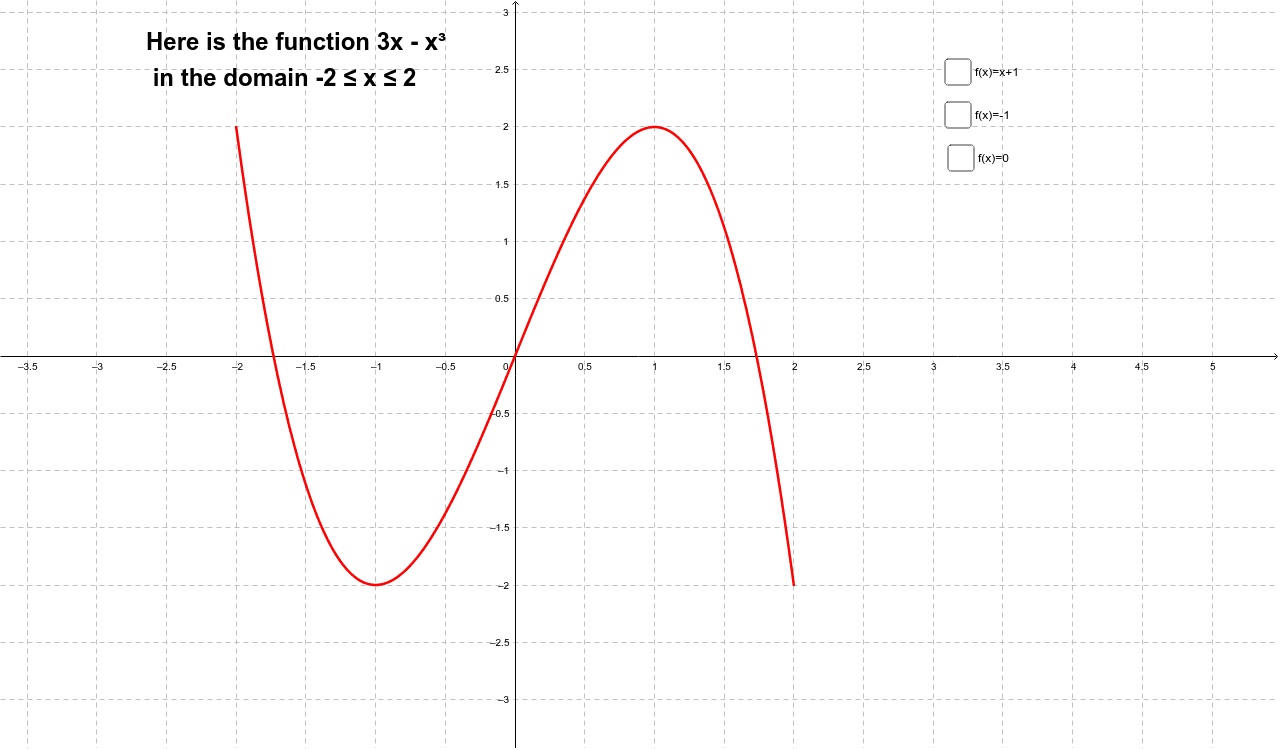
This example illustrates the graph of the cubic function f(x) = 3x - x^3 and investigates its intersections with the lines f(x) = 0, f(x) = -1, and f(x) = x+1 = g(x). Key math concepts include function graphing, equation solving, and intersection points. GeoGebra commands used are Function and Intersect, with objects like f, a, b, c, d, e, g, A, B, C, h, D, E, F, i, j, G, H, I, text1. Suitable for high school mathematics education to understand function properties and systems of equations.
GeoGebra Commands & Parameters
Function((3 * x) - x^(3), -2, 2) → fIntersect(f, b, 1) → AIntersect(f, b, 2) → BIntersect(f, b, 3) → CIntersect(f, a, 1) → DIntersect(f, a, 2) → EIntersect(f, a, 3) → FIntersect(f, e, 1) → GIntersect(f, e, 2) → HIntersect(f, e, 3) → I
AI Drawing Prompt Reference
Graph the cubic function f(x) = 3x - x^3, and find its intersections with the x-axis, the line y = -1, and the line y = x + 1. First, graph the function, then find the three intersection points with the x-axis, the two intersection points with the line y = -1, and the two intersection points with the line y = x + 1.
The prompt above was compiled from the original drawing commands and is for reference only.