
Graphical & Symbolic Solving of Quadratic Equations
Loading the math board and drawing, please wait…
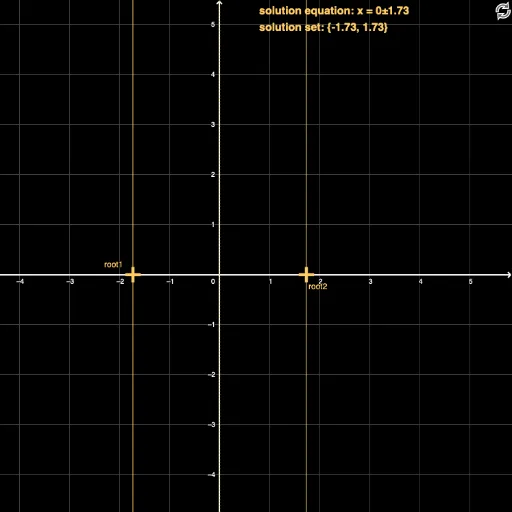
This example demonstrates solving quadratic equations both graphically and symbolically. It involves core math concepts like quadratic function graphs, discriminant, roots, and intersections of linear and quadratic functions. GeoGebra commands used include OrthogonalLine and Point, with objects like a, b, c, A, B, C, disc, root1, root2, F, G, d, e, h, i, constant, linear, quad, scale, p, f, text series, D, E, H, I, g, q, j, text8, text9, f0, k, fo, po. Suitable for high school mathematics education to understand the geometric meaning of quadratic equation solutions and algebraic calculations.
GeoGebra Commands & Parameters
OrthogonalLine(F, xAxis) → dOrthogonalLine(G, xAxis) → ePoint(e) → DPoint(yAxis) → EPoint(d) → HPoint(yAxis) → I
AI Drawing Prompt Reference
Draw a quadratic function graph F and another G, and their two vertical lines to the x-axis. Then draw the tangents d and e perpendicular to the x-axis for F and G. Next, take a point D on tangent e, a point E on the y-axis, a point H on tangent d, and a point I on the y-axis.
The prompt above was compiled from the original drawing commands and is for reference only.