
Graphical Representation of Complex Roots: Quadratic Functions and the Unit Circ
Loading the math board and drawing, please wait…
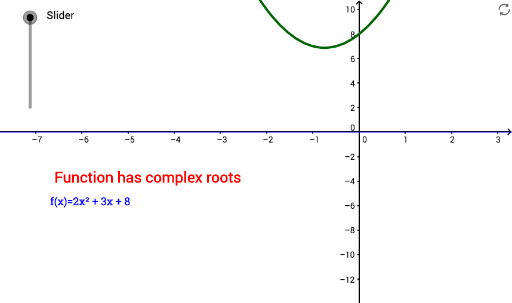
This GeoGebra example dynamically visualizes the complex roots of a quadratic function, mapping them onto the complex plane to make abstract concepts tangible. It demonstrates how roots appear as conjugate pairs when the discriminant is negative, and how they relate to the unit circle and the coefficients of the polynomial. The construction uses the Intersect command to find intersections between the function graph and axes, along with sliders and text objects to adjust parameters and observe root trajectories. This resource is ideal for high school and early college students studying complex numbers, quadratic equations, and the geometric interpretation of roots, serving as a bridge to more advanced topics in complex analysis and calculus.
GeoGebra Commands & Parameters
Intersect(f, g) → D, E
AI Drawing Prompt Reference
Create a dynamic visualization showing the complex roots of a quadratic function when the discriminant is negative. Use a unit circle as a reference in the complex plane, and mark the intersections of the function graph with the coordinate axes. Display a pair of conjugate complex roots that are symmetric about the real axis. Include sliders to adjust the coefficients of the quadratic, allowing the roots to move and trace their paths on the complex plane. Show text indicating the current coefficients and root values. The graphic should clearly present the function curve, the unit circle, the axes, and the root positions to illustrate the relationship between complex roots, polynomial coefficients, and the unit circle.
The prompt above was compiled from the original drawing commands and is for reference only.