
Graphical Method for Solving Quadratic Inequalities
Loading the math board and drawing, please wait…
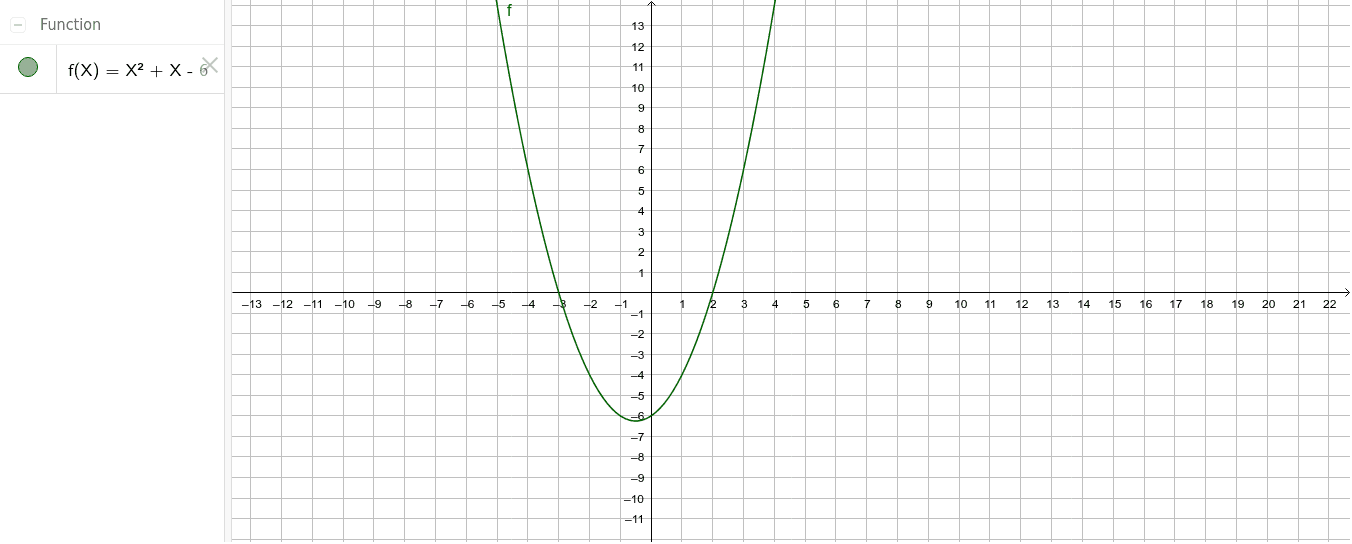
This example demonstrates how to solve quadratic inequalities using a graphical method. Key math concepts involved include quadratic functions, solution sets of inequalities, and function graphs. GeoGebra commands used include the function object f to plot the quadratic function and analyze its position relative to the x-axis to determine the solution set. Suitable for high school students learning about quadratic functions and inequality solving.
GeoGebra Commands & Parameters
f(X) = X^(2) + X - 6