
Graph of y = a/x
Loading the math board and drawing, please wait…
In collections
Mathematics (Power Functions)
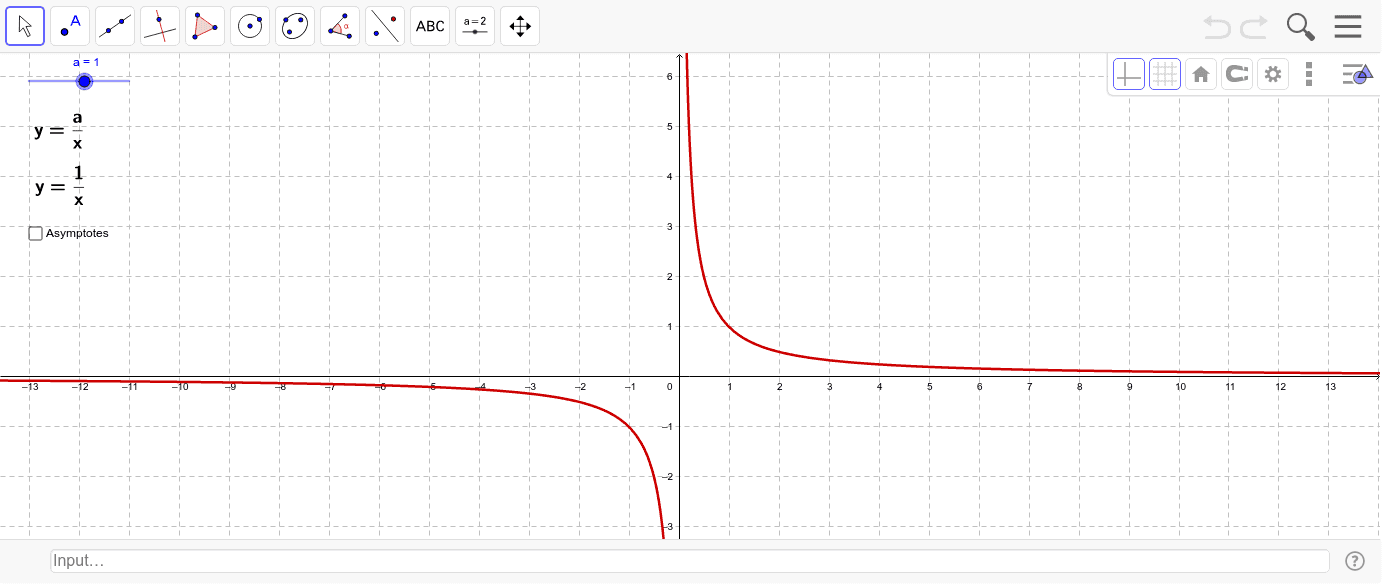
This example demonstrates the graph of the inverse proportion function y=a/x, including its asymptotes and symmetry. Key math concepts involve inverse proportion functions, asymptotes, symmetry, and slope. GeoGebra commands used include objects a (parameter), f (function), text1 & text2 (texts), b & c (points), Asymptote (asymptote), and text3 & text4 (labels). Suitable for high school mathematics education to understand the characteristics and transformations of inverse proportion function graphs.
GeoGebra Commands & Parameters
Numeric a(1.0)f(x) = a / xLine b(0.0, 1.0, 0.0)Line c(1.0, 0.0, 0.0)Boolean Asymptote(false)
AI Drawing Prompt Reference
Draw the graph of the inverse proportion function y=a/x with asymptotes along the x-axis and y-axis, labeled as such. The function should be plotted for a=1 to show the basic shape, and the graph should highlight its symmetry. Mark two points at the origin, one on the x-axis and one on the y-axis, to help illustrate the concept of asymptotes.
The prompt above was compiled from the original drawing commands and is for reference only.