
Function Transformations by Vincent Shuali
Loading the math board and drawing, please wait…
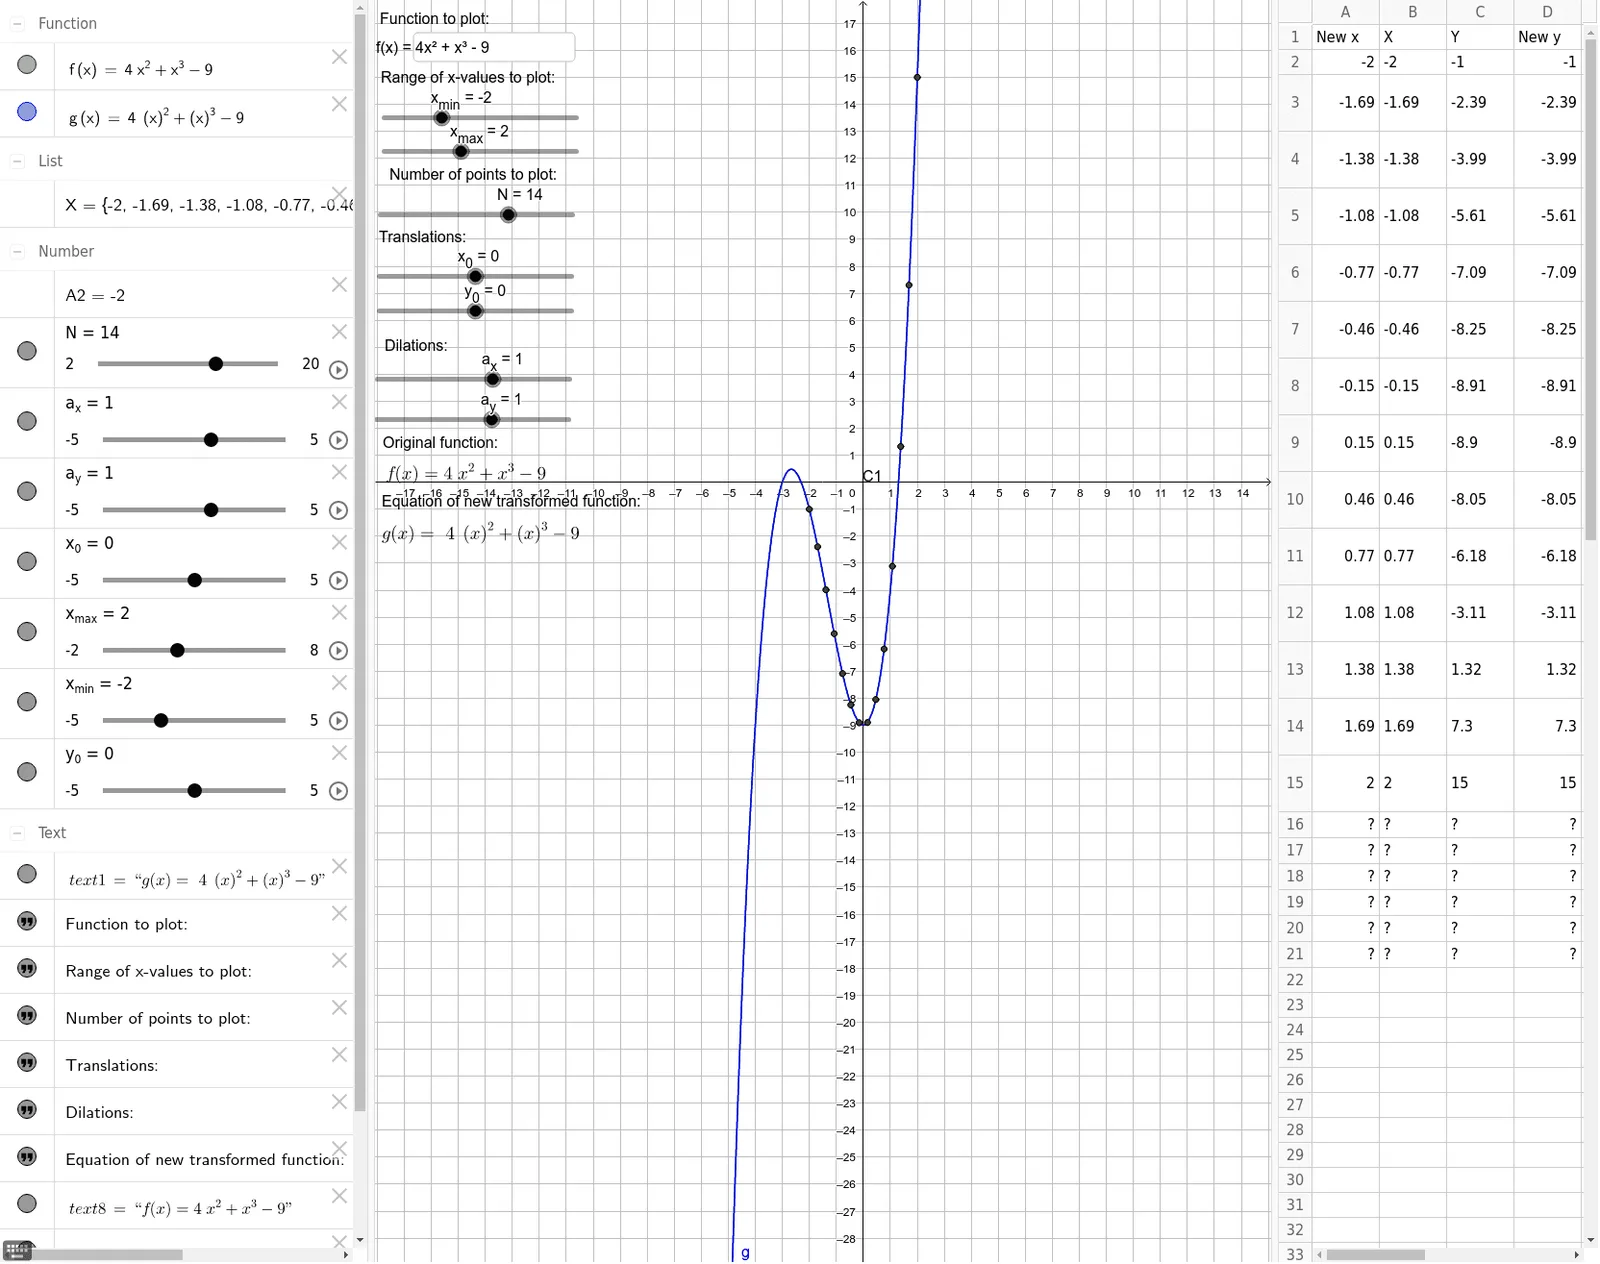
This example demonstrates the concept of function transformations, including translations and scalings. It involves core mathematical concepts such as functions, linear functions, polynomial functions, power functions, quadratic functions, trigonometric functions, and step functions. Using GeoGebra commands like Sequence, Element, Textfield, If, and Vector, it dynamically shows changes in function graphs. Suitable for high school mathematics education and learning.
GeoGebra Commands & Parameters
Sequence(x_{min} + (i * (x_{max} - x_{min}) / (N - 1)), i, 0, N - 1) → XElement(X, H2) → I2Textfield(f) → InputBox1If(a_x ≟ 1, If[a_y ≠ 1, (a_y * f(x - x_0)) + y_0, f(x - x_0) + y_0], If[a_y ≠ 1, (a_y * f((x - x_0) / a_x)) + y_0, f((x - x_0) / a_x) + y_0]) → gVector(F2, E2) → G2_1Vector(F3, E3) → G3Vector(F4, E4) → G4Vector(F5, E5) → G5Vector(F6, E6) → G6Vector(F7, E7) → G7Vector(F8, E8) → G8Vector(F9, E9) → G9Vector(F10, E10) → G10Vector(F11, E11) → G11Vector(F12, E12) → G12Vector(F13, E13) → G13Vector(F14, E14) → G14Vector(F15, E15) → G15Vector(F16, E16) → G16Vector(F17, E17) → G17Vector(F18, E18) → G18Vector(F19, E19) → G19Vector(F20, E20) → G20Vector(F21, E21) → G21Element(X, H3) → I3Element(X, H4) → I4Element(X, H5) → I5Element(X, H6) → I6Element(X, H7) → I7Element(X, H8) → I8Element(X, H9) → I9Element(X, H10) → I10Element(X, H11) → I11Element(X, H12) → I12Element(X, H13) → I13Element(X, H14) → I14Element(X, H15) → I15Element(X, H16) → I16Element(X, H17) → I17Element(X, H18) → I18Element(X, H19) → I19Element(X, H20) → I20Element(X, H21) → I21
AI Drawing Prompt Reference
Create a dynamic graph illustrating function transformations, focusing on translations and scalings. The graph should feature an original function curve, such as a trigonometric or quadratic function, and a transformed curve derived via horizontal and vertical shifts, along with horizontal and vertical scalings. Use a sequence of points to define the domain and represent transformation parameters with vectors. The graph must interactively show real-time changes as parameters are adjusted, suitable for high school math education.
The prompt above was compiled from the original drawing commands and is for reference only.