
Function Graphing and Curve Analysis Example
Loading the math board and drawing, please wait…
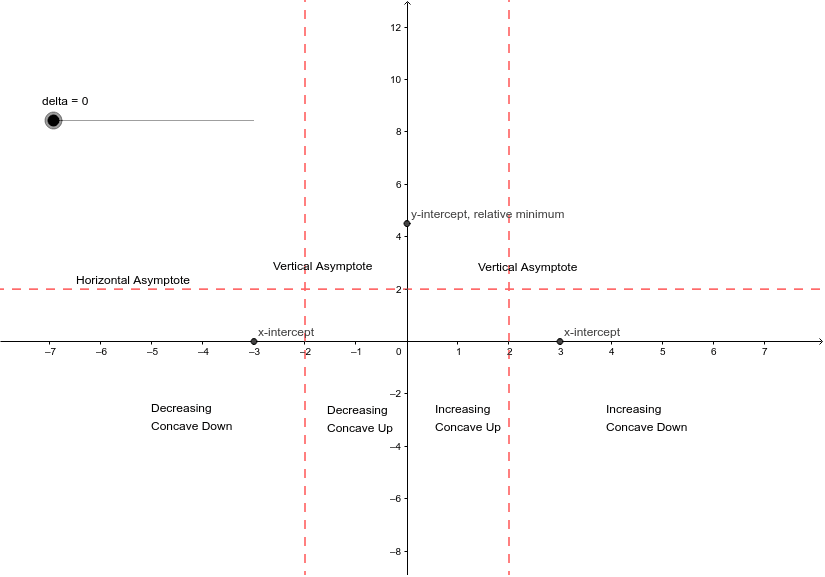
This example demonstrates how to draw and analyze function graphs, particularly the shapes of ellipses and hyperbolas using GeoGebra. Key math concepts include functions, derivatives, extrema, roots, rotation, and analytical geometry. The construction utilizes GeoGebra commands like Extremum (for finding extrema), Roots (for finding roots), and If (for conditional logic), along with objects such as f (function), e1 (ellipse), r1,r2 (rotation parameters), and a,b,c (parameters), plus text elements for annotations. Suitable for high school and above students learning graphing techniques and curve properties.
GeoGebra Commands & Parameters
Extremum(f, -1, 1) → e1Roots(f, -4, 4) → r1, r2If(x ≥ x(r1) - delta, If[x ≤ x(r1) + delta, If[x < -2, (2 * (x^(2) - 9)) / (x^(2) - 4)]]) → f1If(x ≥ x(e1) - delta, If[x ≤ x(e1) + delta, (2 * (x^(2) - 9)) / (x^(2) - 4)]) → f2If(x ≥ x(r2) - delta, If[x ≤ x(r2) + delta, If[x > 2, (2 * (x^(2) - 9)) / (x^(2) - 4)]]) → f3