
Fourier Transform Visualization (P489 EX6)
Loading the math board and drawing, please wait…
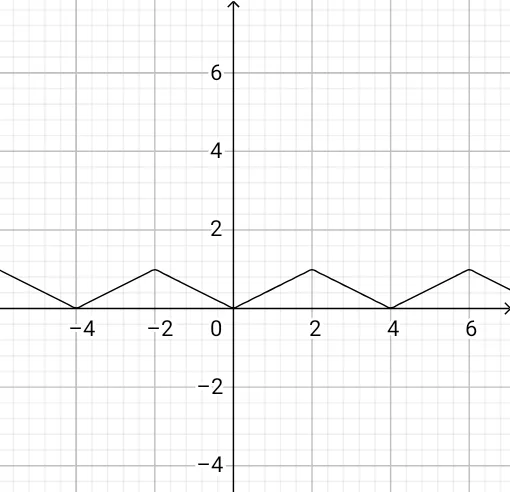
① This GeoGebra example demonstrates the Fourier transform by decomposing a periodic signal into a sum of sinusoidal components, showing how the time-domain function relates to its frequency-domain representation through rotating vectors in the complex plane. ② Core mathematical concepts include Fourier series, integral transforms, complex exponentials, spectral decomposition, and convergence of infinite sequences. ③ Construction highlights: The Sequence command generates multiple harmonic terms, while objects a (likely amplitude/frequency parameter), l2 (list or path), and f (function or transform result) are used to build the visualization; a slider controls the number of terms to show partial sums approaching the original function. ④ Suitable for university-level mathematics, signal processing, or physics courses, this example helps students grasp the geometric meaning of Fourier analysis and its numerical implementation, serving as a valuable tool for calculus or complex analysis instruction.
GeoGebra Commands & Parameters
Sequence(((4 / ((n^(2) * π^(2))) * ((2 * cos(((π * n)) / 2)) - cos((π * n)) - 1)) * cos((((π * n) * x)) / 4)), n, 1, a) → l2