
Fit Graph: Sinusoid_1, Vertical Dilation
Loading the math board and drawing, please wait…
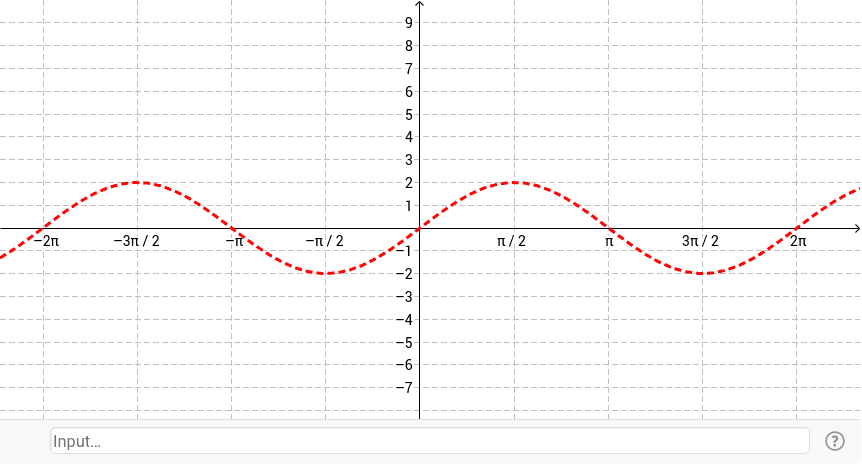
① This example demonstrates how to match a given sinusoidal graph by adjusting the vertical dilation factor, helping students understand how the amplitude parameter affects the shape of the sine curve. ② The core mathematical concept is vertical dilation of the sine function, i.e., how changing the coefficient A in y = A·sin(x) alters the peak and trough heights while leaving the period and phase unchanged. ③ Construction notes: The GeoGebra construction defines a single function object f (as seen in the summary), and students interact by observing the graph and entering or adjusting the equation's coefficient to make their function coincide with the target graph; this version focuses solely on vertical dilation, excluding horizontal shifts, phase changes, or period changes, making it a foundational exercise in transformation series. ④ It is suitable for high school students learning trigonometric functions, or as an interactive classroom activity for exploring amplitude and graph transformations.
GeoGebra Commands & Parameters
f(x) = Random[1, 5] * sin(x)
AI Drawing Prompt Reference
Draw a sine curve with an amplitude randomly chosen between 1 and 5, showing vertical dilation. The wave oscillates around the x-axis, with peaks and troughs at heights determined by the amplitude, while the period remains 2π and there is no horizontal shift or phase change. Include coordinate axes and emphasize the curve's shape to illustrate how changing the amplitude affects the vertical stretch. Provide a slider or adjustable parameter so users can modify the amplitude to match a target graph.
The prompt above was compiled from the original drawing commands and is for reference only.