
Exponential Function Graphs (with x-intercept labeled)
Loading the math board and drawing, please wait…
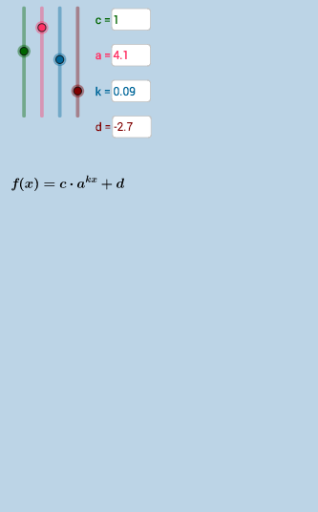
This example demonstrates the graph of exponential functions with labeled x-intercepts. Key math concepts include exponential function properties, graph transformations, and the significance of x-intercepts. Construction involves using GeoGebra commands like Textfield and Intersect, with objects such as a, k, c, d, g, f, etc., to dynamically plot the function and annotate the x-intercept. Suitable for high school mathematics education to understand exponential function graphs and parameter effects.
GeoGebra Commands & Parameters
Textfield(a) → InputBox1Textfield(c) → InputBox2Textfield(k) → InputBox3Textfield(d) → InputBox5Intersect(g, xAxis) → BIntersect(g, xAxis) → CIntersect(g, xAxis) → DIntersect(f, xAxis, (7.821568176639432, -9.947598300641403E-14)) → E