
Exploring Integers with Thermometer Model
Loading the math board and drawing, please wait…
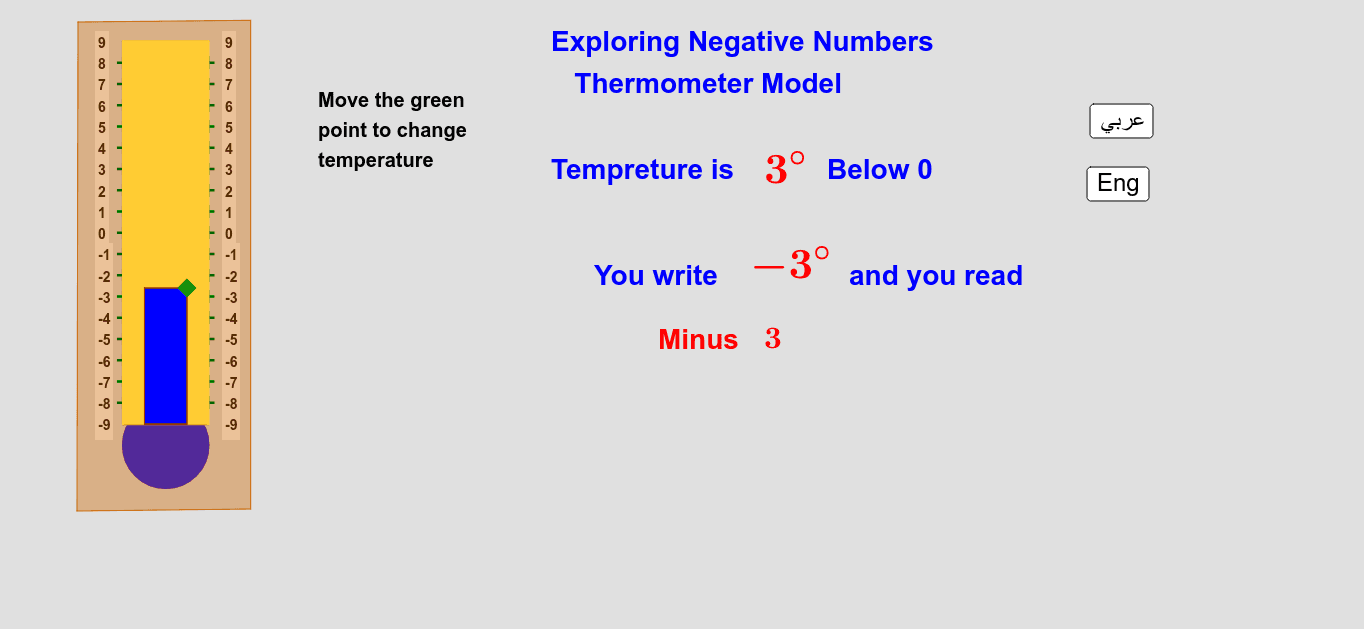
This example uses a thermometer model to explore negative numbers. By observing the rise and fall of the thermometer, the concept of positive and negative numbers on a number line is demonstrated. Core mathematical concepts include the representation of negative numbers on a number line and the positivity or negativity of temperature changes. The construction involves commands such as Point, Segment, Polygon, Circle, and Sequence in GeoGebra. Suitable for students from upper elementary to middle school learning about integers.
GeoGebra Commands & Parameters
Point(q) → TSegment(A, C) → aSegment(B, D) → bSegment(B, A) → cSegment(D, C) → dPolygon(A, B, D, C) → poly1, a_1, b_1, d_1, c_1Circle(F, 1) → fPolygon(A, C, D, B) → poly2, a_2, c_2, d_2, b_2Sequence((x(A), y(A) + (k * e)), k, 1, 17) → list1Sequence((x(B), y(B) + (k * e)), k, 1, 17) → list3Polygon((-1.5, -4.5), (-1.5, y(T)), (-2.5, y(T)), (-2.5, -4.5)) → poly3, g, i, j, kSequence(Text[k, (x(A) + 0.4, y(A) - 0.15 + ((k + 9) * e))], k, -9, 9) → list2Sequence(Text[k, (x(B) - 0.6, y(B) - 0.15 + ((k + 9) * e))], k, -9, 9) → list4Polygon((-1.5, -4.5), (-1.5, y(T)), (-2.5, y(T)), (-2.5, -4.5)) → poly4, h, l, m, nCircle(F, 1) → pPolygon(E, G, H, I) → poly5, e_1, g_1, h_1, i_1
AI Drawing Prompt Reference
Draw a thermometer model to illustrate positive and negative numbers. Start by drawing the temperature scale lines, then connect the endpoints of the scale lines with segments to form the thermometer's body. Next, draw the circular part of the thermometer using polygons and circles to represent the scale disk. Finally, use the sequence command to generate scale numbers from -9 to 9, marking them on both sides of the thermometer.
The prompt above was compiled from the original drawing commands and is for reference only.