
Exploring Fractions - 1
Loading the math board and drawing, please wait…
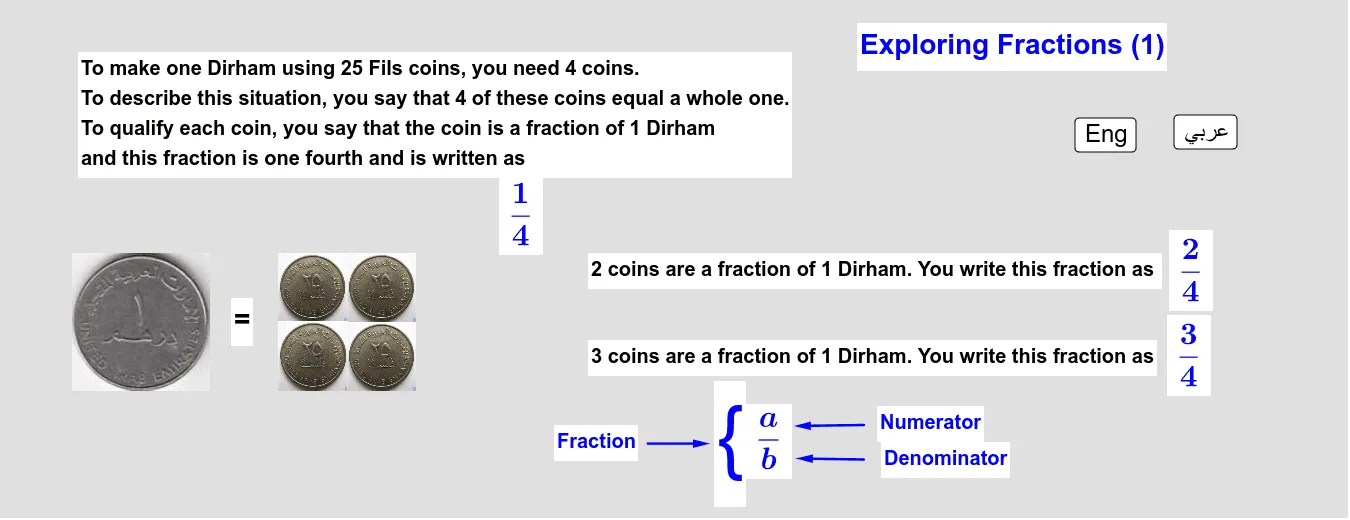
① This example demonstrates how to visualize fractions on a coordinate plane using randomly generated fraction points and vectors to show magnitude, position, and variation trends. ② Core mathematical concepts include fraction representation, coordinate geometry, variance statistics, function graphs, limits, and definite integrals. ③ Construction highlights: Random command creates parameters n and m; Vector command builds vectors u, v, w for fraction vectors; numerous text objects (text2‑text17) label values, provide bilingual labels (Eng, Arab) and buttons (button2, button3) for animation control; auxiliary points O, A, B, C, D, E, F, G, H, I, J, K, L, N, P, Q, R and image pic2 form the interactive scene. ④ Suitable for middle‑school fraction lessons, high‑school coordinate geometry and introductory calculus demonstrations, and as a reference template for developing dynamic GeoGebra applets.
GeoGebra Commands & Parameters
Random(1, 25) → nRandom(1, n) → mVector(B, C) → uVector(D, E) → vVector(F, G) → w
AI Drawing Prompt Reference
Create a coordinate plane scene for exploring fractions: randomly generate two integers as numerator and denominator, then draw three vectors in different directions to represent the fraction's magnitude, position, and variation trend. The vectors start from distinct auxiliary points and end at coordinates corresponding to the fraction values. Include multiple text labels showing numerical values, bilingual annotations (English and Arabic), and two buttons for animation control. Place several auxiliary points to anchor the vectors and build a reference framework, plus an image as background decoration. The overall layout should clearly show the fraction's position on the plane, vector lengths reflecting numerical size, and the trend of variation, suitable for middle-school math teaching.
The prompt above was compiled from the original drawing commands and is for reference only.