
Examining the Derivative as the Slope of a Curve's Tangent
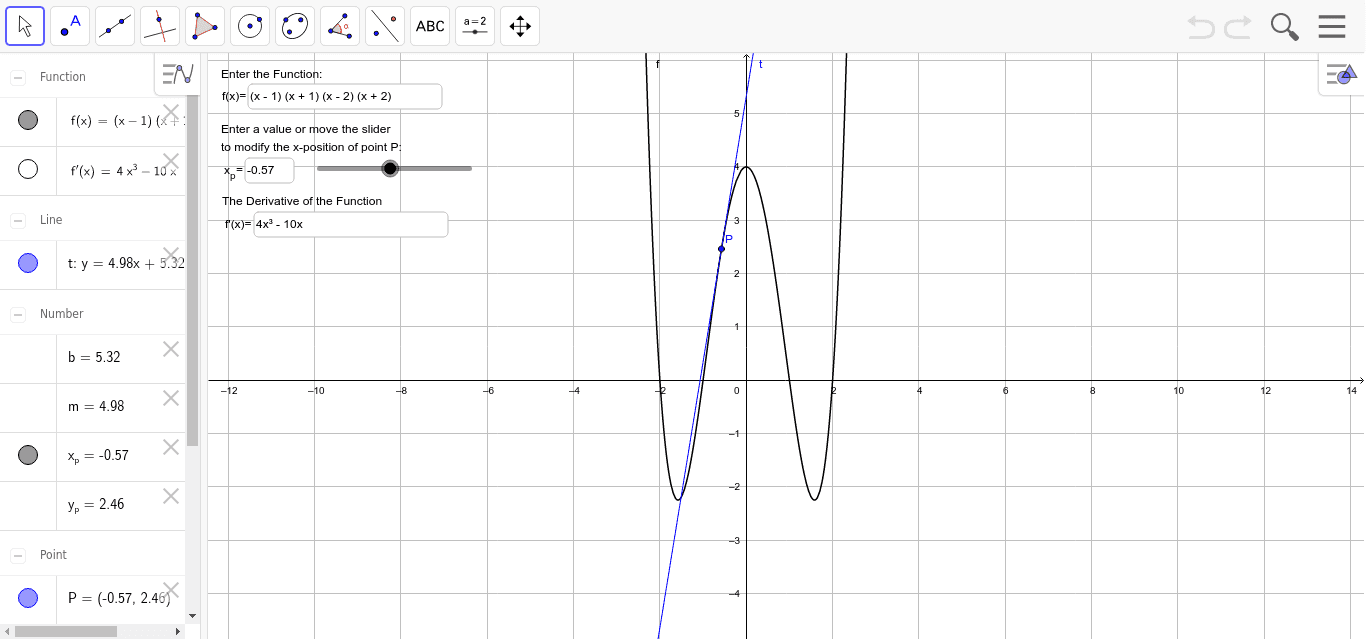
Loading the math board and drawing, please wait…
This example demonstrates how to dynamically show the derivative of a function at a point is the slope of the tangent line at that point using GeoGebra. Core math concepts include derivative, tangent function, polynomial functions, difference and slope, right triangles, and hyperbola. Construction highlights the use of Textfield command to display objects like function f, point P(x_p, y_p), slope m, intercept b, tangent t, function graph, x position, derivative f', text function, derivative text, textX_p, and textDerivative. Suitable for high school and above students learning calculus and analytical geometry.
GeoGebra Commands & Parameters
Textfield(f) → functionTextfield(x_p) → xPositionTextfield(f') → derivative
AI Drawing Prompt Reference
Draw a coordinate plane with a polynomial function curve. Place a movable point on the curve and draw its tangent line at that point. Show the slope and intercept of the tangent, and illustrate the slope as a right triangle's vertical over horizontal difference. Also display the derivative function as a separate curve. Include three input fields: one for the function formula, one for the x-coordinate of the point, and one for the derivative expression. All labels and values update dynamically.
The prompt above was compiled from the original drawing commands and is for reference only.