
Equations for Self-Drawn Graphs
Loading the math board and drawing, please wait…
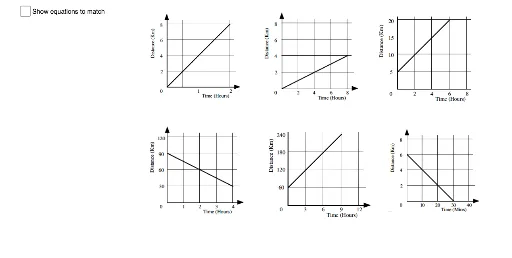
This example demonstrates how to construct equations based on given graphs. Key mathematical concepts include functions and coordinate geometry. Using GeoGebra commands such as objects, points, and images, users can learn how to extract mathematical information from graphs. Suitable for high school mathematics education and learning.
GeoGebra Commands & Parameters
Point A(3.0318561816521084, -4.624761648440563)Point B(8.171856181652107, -4.624761648440563)Point C(14.94, 1.26)Point D(19.74, 1.26)Point E(3.104, 1.412)Point F(7.88, 1.412)Point G(8.964, 1.292)Point H(14.044, 1.292)Point I(15.484, -4.368)Point J(20.26, -4.37)Point K(9.184, -4.828)Point L(14.324, -4.828)Point M(9.26, -4.736)Point N(14.62, -4.74)Boolean a(false)
AI Drawing Prompt Reference
Draw a graph with multiple points forming two parallel line segments and two curves. Start by drawing points A (3.03, -4.62) and B (8.17, -4.62) to create the first line segment. Then draw points C (14.94, 1.26) and D (19.74, 1.26) to create the second line segment. Next, draw points E (3.10, 1.41), F (7.88, 1.41), G (8.96, 1.29), and H (14.04, 1.29) to form the first curve. Finally, draw points I (15.48, -4.37), J (20.26, -4.37), K (9.18, -4.83), L (14.32, -4.83), M (9.26, -4.74), and N (14.62, -4.74) to form the second curve.
The prompt above was compiled from the original drawing commands and is for reference only.