
Ed's Squares
Loading the math board and drawing, please wait…
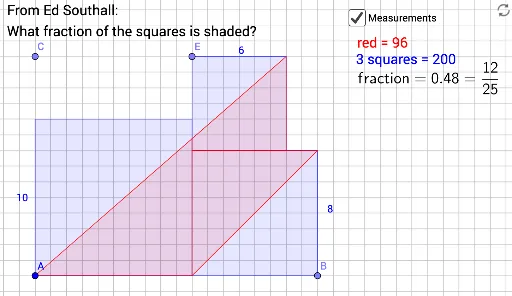
This example demonstrates the construction and exploration of geometric figures through dynamic points, focusing on area and transformation relationships. Core math concepts include area calculation, fractions, squares, dilation, variance, probability distributions, and trigonometry. It uses GeoGebra commands and objects like Point, Polygon, Intersect, IntersectPath, Sum. Suitable for high school and above students to intuitively understand geometric transformations and probability statistics.
GeoGebra Commands & Parameters
Point(Ray[A, A + (1, 0)]) → BPoint(Ray[A, A + (0, 1)]) → CPoint(Segment[D - (Distance[A, C], 0), C + (Distance[A, C], 0)]) → EPolygon(J, K, L, E) → q2, j, k, l, ePolygon(B, M, J, G) → q3, b, m, j_1, g_1Polygon(A, G, M, D, L) → q4, f, n, q_1, r_1, s_1Polygon(A, G, I, H) → q1, a, g, i, hIntersect(Segment[C, D], Line[A, Line[G, M]]) → FIntersect(Line[C, D], Line[G, M]) → NIntersectPath(q2, q4) → q5, O, P, Q, R, p, q, r, sIntersectPath(q3, q4) → t1, T, U, V, c, d, f_1IntersectPath(q1, q4) → t3, W, Z, A_1, h_1, i_1, k_1Sum(rd) → red
AI Drawing Prompt Reference
Draw a dynamic geometric figure consisting of four squares, with a central square and three surrounding it. Use dynamic points to define the vertices of the squares and show the area and transformation relationships. Adjust the size and position of the squares using a slider to observe area changes and probability distributions. The figure should include multiple intersections and paths, with different parts distinguished by color.
The prompt above was compiled from the original drawing commands and is for reference only.