
Describing Large and Small Numbers Using Powers of 10: IM 8.7.9 Lesson
Loading the math board and drawing, please wait…
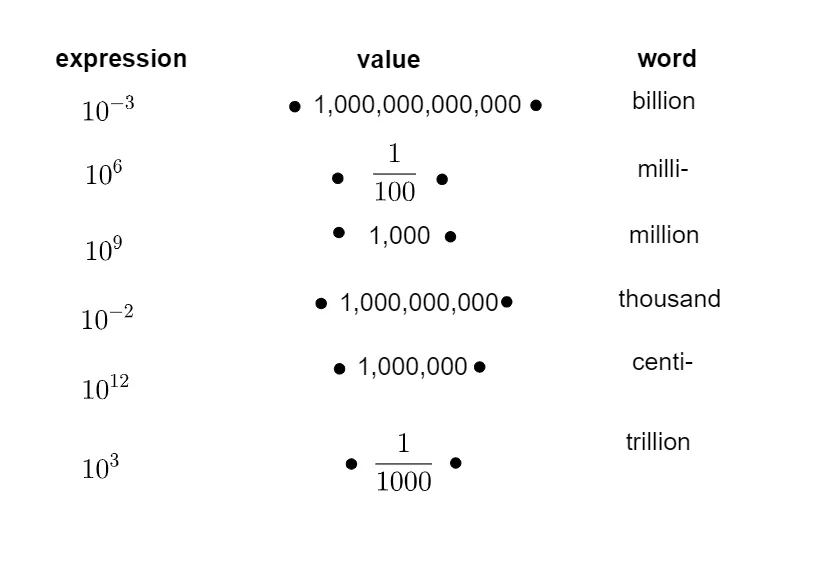
This GeoGebra interactive lesson from Illustrative Mathematics 8.7.9 demonstrates how to use powers of 10 (scientific notation) to describe extremely large and small numbers. The core mathematical concepts include exponents, orders of magnitude, scientific notation, and comparing numbers of different scales. The construction uses the Segment command and creates multiple text objects (text1 through text21) along with points A, B, C, D, E, F, G, H, I, J, K, L and functions f, g, h, i, j, k. These elements likely serve to mark positions on a number line or to illustrate the relative sizes of powers of ten through segments and labels. This resource is suitable for middle school students (around grade 8) learning scientific notation, and can be used for classroom demonstrations or independent exploration to build intuition about exponential growth and scale differences.
GeoGebra Commands & Parameters
Segment(A, B) → fSegment(C, D) → gSegment(E, F) → hSegment(G, H) → iSegment(I, J) → jSegment(K, L) → k
AI Drawing Prompt Reference
Draw a horizontal number line with tick marks representing various integer powers of 10, from negative to positive exponents. Create six segments of different lengths, each connecting a pair of tick marks to indicate a range of one order of magnitude. Label each segment with its corresponding power value. The segments should visibly increase in length as the exponent grows, clearly illustrating the dramatic scale differences between small and large numbers.
The prompt above was compiled from the original drawing commands and is for reference only.