
Derivative Explanation
Loading the math board and drawing, please wait…
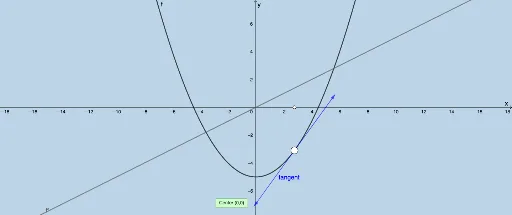
This example demonstrates the geometric meaning of a derivative at a point, i.e., the slope of the tangent line. It involves core math concepts like derivatives, fractions, geometry, polynomial functions, median line, and surface. GeoGebra commands used include Textfield, Point, Intersect, Slope, Segment, Dilate, Vector, Distance, Circle. Suitable for high school mathematics teaching to visually understand the definition and calculation of derivatives.
GeoGebra Commands & Parameters
Textfield(f) → InputBox1Point(f) → AIntersect(g, h) → CSlope(Line[A, C]) → aIntersect(f', k) → ESegment(A, F) → jDilate(A, If[0 < b ≤ 1, 1 - b, 0], B) → A'Segment(A, A') → mDilate(B, If[1 < b ≤ 2, 2 - b, 0], C) → B'Segment(B, B') → nVector(B, B') → uDistance(B, C) → distanceBCDilate(B, If[2 < b ≤ 3, 3 - b, 0], D) → B'_1Vector(B, B'_1) → vDilate(C, If[2 < b ≤ 3, 3 - b, 0], E) → C'Vector(B'_1, C') → wDilate(A, If[1 < b ≤ 2, 2 - b, 0], D) → A'_1Segment(A, A'_1) → pDistance(B'_1, C') → distanceB'1C'Circle(A, 5) → dIntersect(d, h, 2) → GIntersect(d, h, 1) → HVector(A, G) → eVector(A, H) → l
AI Drawing Prompt Reference
Draw a function curve and label its derivative geometrically, showing the slope of the tangent line. First, plot the function and an auxiliary line, find their intersection, calculate the slope at that point, and display it. Then, use scaling and parallel line constructions to illustrate the geometric representation of the derivative. Finally, add some helper circles and vectors to make the diagram clearer and label key points and segments.
The prompt above was compiled from the original drawing commands and is for reference only.