
Cosine Curve Transformations: Exploring Amplitude, Period, and Phase
Loading the math board and drawing, please wait…
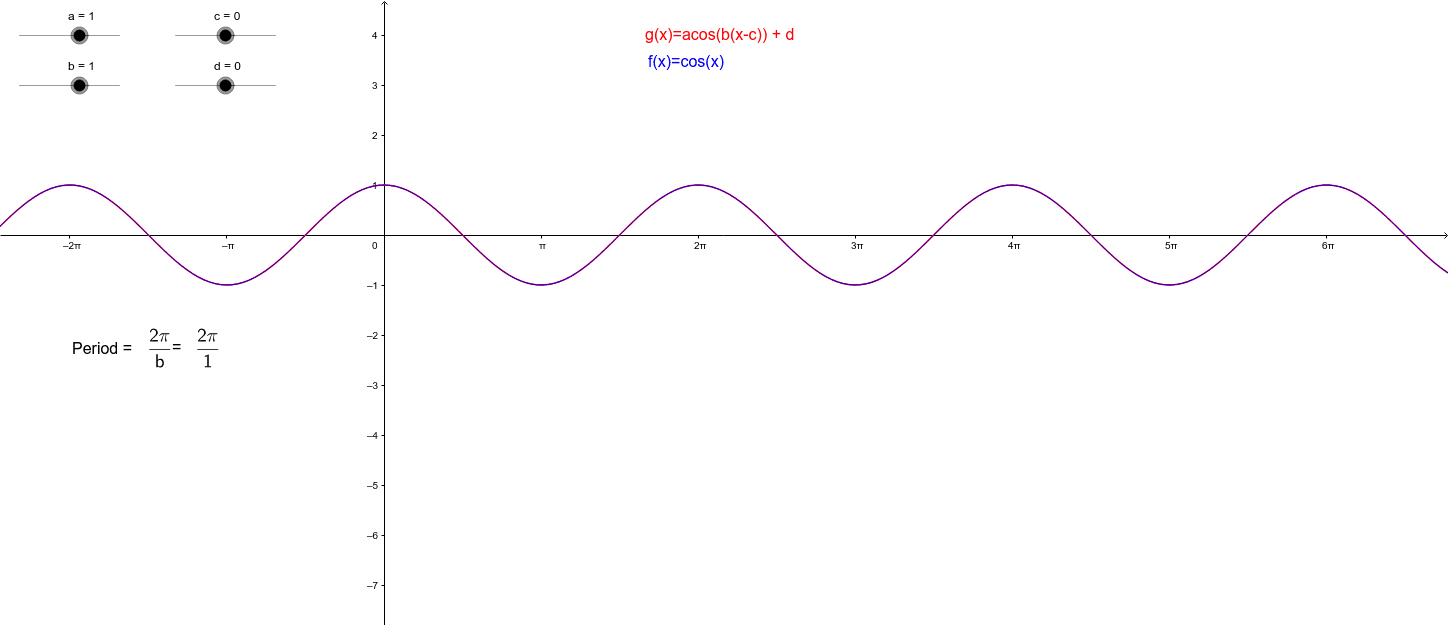
① This GeoGebra example dynamically demonstrates the transformations of the cosine function y=a·cos(bx+c)+d, visually showing how parameters a, b, c, and d affect the shape and position of the curve. ② Core mathematical concepts include amplitude, period, phase shift, and vertical translation of trigonometric functions, as well as geometric transformations (stretching, shifting) of function graphs. ③ Construction highlights: From the construction summary, sliders (a, b, c, d) control parameters, function objects (f, g, h) define cosine curves at different transformation stages, and text objects (text1 to text12) label key points or equations; piecewise functions or parametric curves may also be used to aid visualization. ④ Suitable for high school trigonometry or pre-calculus classes, ideal for classroom demonstrations or student self-exploration to understand how parameter changes correspond to graph transformations.
GeoGebra Commands & Parameters
Numeric a(1.0)Numeric b(1.0)Numeric c(0.0)Numeric d(0.0)f(x) = a * sin(b * x - c) + dg(x) = a * cos(b * x - c) + dh(x) = cos(x)
AI Drawing Prompt Reference
Draw a dynamic illustration showing the transformations of the cosine function y=a·cos(bx+c)+d, featuring four sliders to control parameters a, b, c, d, three curves representing cosine function graphs at different transformation stages, and text labels for key points or equations, visually demonstrating how parameter changes affect the curve's shape and position, suitable for high school trigonometry or pre-calculus class demonstrations.
The prompt above was compiled from the original drawing commands and is for reference only.