
Correlation Investigation: Dynamic Scatterplot and Pearson's r
Loading the math board and drawing, please wait…
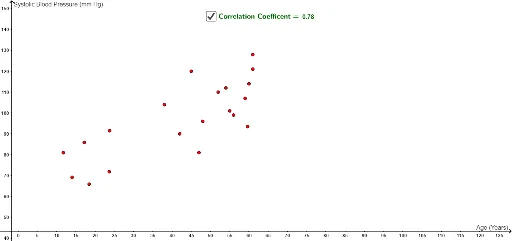
① This example demonstrates a scatterplot of multiple 2D points (A1 to A21, B1, C1 to C18) that dynamically updates the Pearson product-moment correlation coefficient (PMCC) as points are moved. ② It focuses on the statistical concept of correlation, including positive, negative, and zero linear relationships, and how the coefficient quantifies strength and direction. ③ Construction uses the GeoGebra command PMCC to compute the correlation, with objects including numerous points, a centroid (barycenter), and 2D vectors, likely allowing interactive dragging to explore how data distribution affects r. ④ Suitable for high school or introductory college statistics courses, this interactive tool helps students grasp the meaning of correlation, its calculation, and its limitations through hands-on manipulation.
GeoGebra Commands & Parameters
PMCC(l1) → r
AI Drawing Prompt Reference
Create a dynamic scatterplot with multiple points, a centroid, and two 2D vectors. Allow the points to be draggable, updating the centroid's position automatically. As the points move, dynamically calculate and display the Pearson correlation coefficient, showing how data distribution affects its value. Include a slider to adjust parameters, demonstrating positive, negative, and zero linear relationships, and how the coefficient quantifies the strength and direction of the relationship.
The prompt above was compiled from the original drawing commands and is for reference only.