
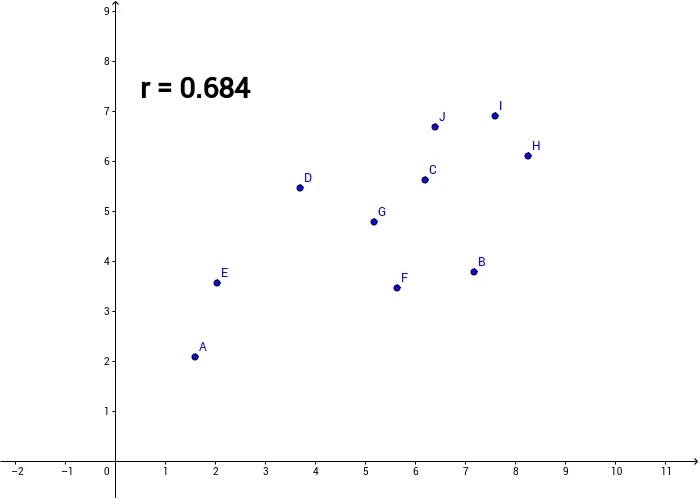
Correlation Experimentation
Loading the math board and drawing, please wait…
In collections
AP Statistics
This example demonstrates the impact of moving ten data points on the correlation coefficient, helping students understand data distribution and correlation. It involves core concepts like correlation coefficient and data analysis, constructed using GeoGebra commands PMCC and objects A to J, r, text1. Ideal for high school mathematics education.
GeoGebra Commands & Parameters
PMCC({A, B, C, D, E, F, G, H, I, J}) → r
AI Drawing Prompt Reference
Create a graph showing the effect of moving data points on the correlation coefficient, including a text display for the correlation coefficient, calculated by finding the correlation among multiple sets of data points, first plot the data points, then calculate and display the correlation coefficient based on them.
The prompt above was compiled from the original drawing commands and is for reference only.