
Continuity of a Function at a Point
Loading the math board and drawing, please wait…
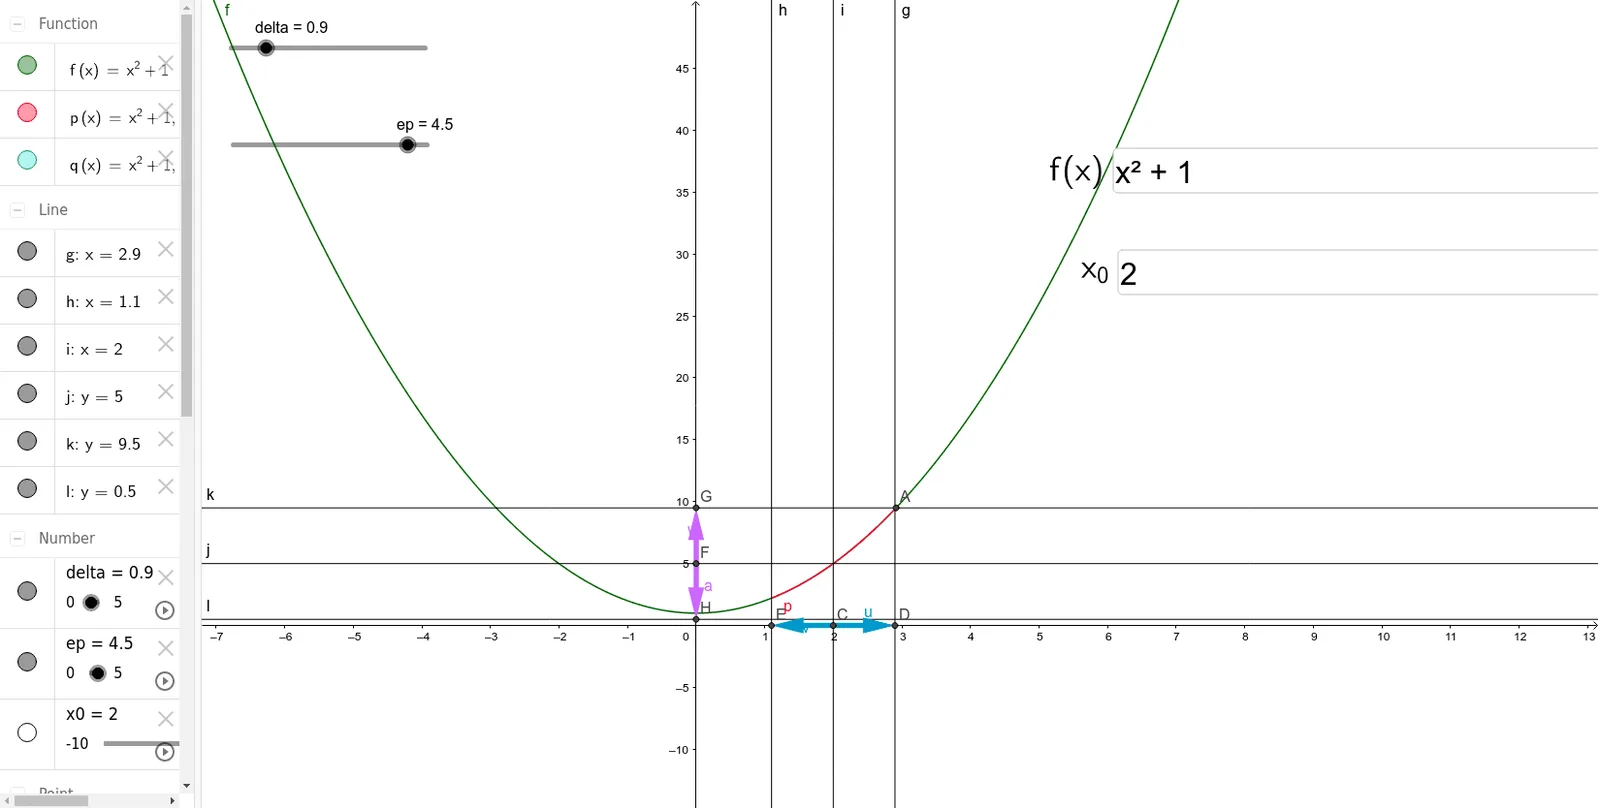
This example demonstrates the continuity of a function at a point. Key mathematical concepts include function continuity, limits, and inequalities. By constructing function f, setting point x0 and δ, and comparing functions g and h, the definition of continuity is illustrated. Commands used include Textfield, Intersect, Vector, etc. Suitable for high school mathematics education and learning.
GeoGebra Commands & Parameters
Textfield(f) → InputBox1Textfield(x0) → InputBox2Intersect(f, k, 2) → AIntersect(f, l, 2) → BIntersect(i, xAxis) → CIntersect(h, xAxis) → EVector(C, E) → vIntersect(g, xAxis) → DVector(C, D) → uIntersect(j, yAxis) → FIntersect(k, yAxis) → GIntersect(l, yAxis) → HVector(F, G) → wVector(F, H) → a
AI Drawing Prompt Reference
Draw a function graph to illustrate the continuity at a point. Input the function expression and point x0, then find intersections of the function with the x-axis and two helper lines. Connect these points to form vectors, and compare function values near x0 using vectors to show the condition for continuity.
The prompt above was compiled from the original drawing commands and is for reference only.