
Cone and Cylinder Volume Rate of Change Problem
Loading the math board and drawing, please wait…
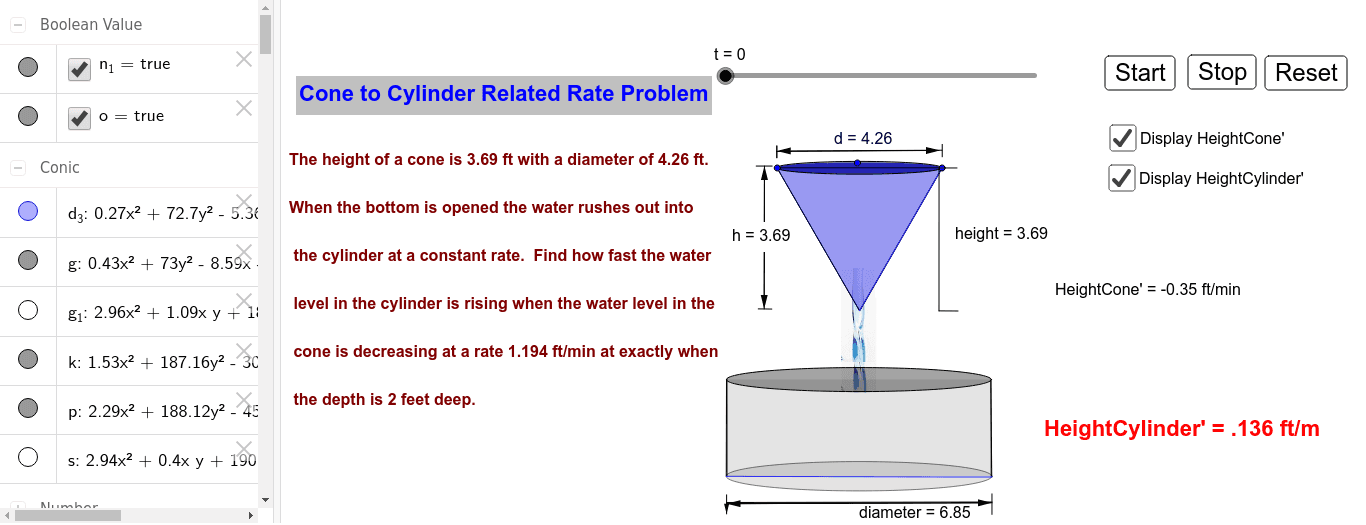
This example demonstrates the problem of the volume rate of change between a cone and a cylinder. Students need to use the height h' and h of the cone to find the volume rate of change V' of the cylinder. By adjusting the volume rate of change V' (positive) of the cylinder, the height rate of change h' of the cone can be found. The example involves concepts of cones, cylinders, and derivatives in calculus, and uses GeoGebra commands such as Polygon, Ellipse, Intersect, Segment, Point, Vector, Distance for geometric construction.
GeoGebra Commands & Parameters
Polygon(A, B, 3) → poly1, d, b, c, CEllipse(D, E, F) → d_3Polygon(C, E, D) → poly2, d_1, c_1, eIntersect(d, b) → GIntersect(d, c) → HSegment(G, H) → fIntersect(d, b) → NIntersect(d, c) → OEllipse(N, O, P) → gEllipse(Q, R, S) → kPolygon(Q, R, T, U) → poly3, q, r, t_1, uEllipse(U, T, V) → pPoint(p) → WPoint(k) → ZSegment(W, Z) → jPoint(p) → A_1Point(k) → B_1Segment(A_1, B_1) → lPolygon(C_1, D_1, E_1, F_1) → poly4, c_2, d_2, e_1, f_1Ellipse(C_1, D_1, G_1) → sEllipse(F_1, E_1, H_1) → g_1Segment(I_1, J_1) → mSegment(I_1, J_1) → nSegment(K_1, L_1) → a_1Point(m) → M_1Vector(M_1, N_1) → vPoint(a_1) → O_1Point(m) → P_1Vector(O_1, P_1) → wSegment(Q_1, R_1) → aSegment(S_1, T_1) → b_1Point(a) → U_1Vector(U_1, V_1) → hVector(V_1, U_1) → v_1Distance(U_1, V_1) → distanceU1V1Segment(W_1, Z_1) → i_1Segment(B_2, A_2) → j_1Point(i_1) → C_2Vector(C_2, Z_1) → u_1Point(j_1) → D_2Vector(D_2, C_2) → diameter_1Vector(C_2, D_2) → k_1Point(i_1) → E_2Point(j_1) → F_2Segment(E_2, F_2) → diameterSegment(H_2, G_2) → heightSegment(G_2, I_2) → l_1Segment(H_2, J_2) → m_1
AI Drawing Prompt Reference
Draw a cone and a cylinder sharing the same base to illustrate the relationship between their volume rates of change. Adjust the volume rate of change of the cylinder to find the height rate of change of the cone. Construct geometric shapes using polygons and ellipses, marking key points, lines, and segments such as the apexes, base centers, intersection points, and height lines of the cone and cylinder. Use vectors to represent height and volume change rates, resulting in a clear visual of the mathematical relationship between them.
The prompt above was compiled from the original drawing commands and is for reference only.