
Comparing Fractions with Lines and Circles
Loading the math board and drawing, please wait…
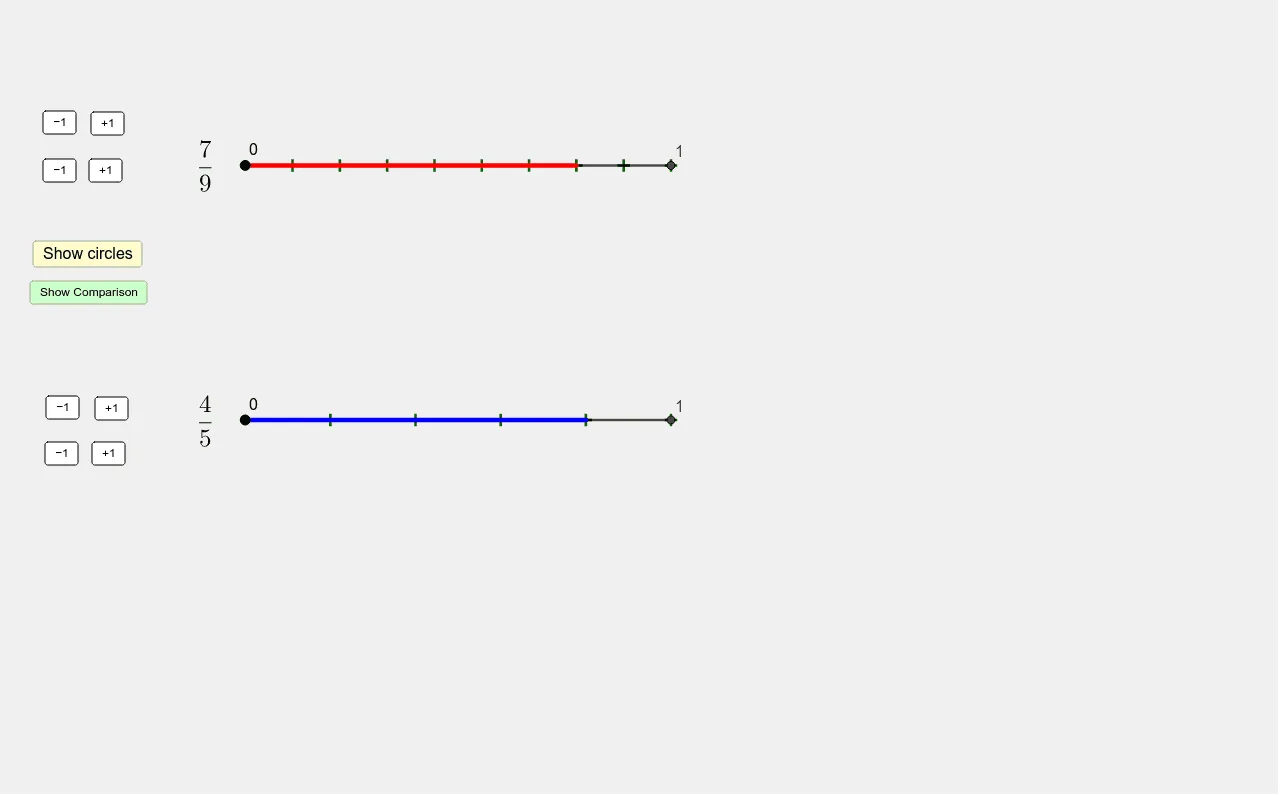
① This example demonstrates how to compare two fractions visually using both line segments and circular sectors. ② The core mathematical concepts include fraction meaning, equivalent fractions, and comparing fraction sizes, linking numerical values to geometric representations. ③ Construction highlights: using GeoGebra commands such as Line, Circle, Point, Segment, Sequence, and CircleSector, the applet creates adjustable line lengths and circle sizes, with sliders controlling numerators and denominators to automatically generate equal partitions and corresponding sectors, along with text labels for the fractions and comparison results. ④ It is suitable for upper elementary to middle school students learning fractions, and serves as an interactive tool for teachers to illustrate fraction comparison in class or for students to explore the geometric interpretation of fractions independently.
GeoGebra Commands & Parameters
Line(A, yAxis) → fPoint(f) → BPoint(f) → CCircle(B, linelength) → cCircle(C, linelength) → dOrthogonalLine(B, f) → gOrthogonalLine(C, f) → hIntersect(c, g, 1) → DIntersect(d, h, 1) → ESegment(B, D) → iSegment(C, E) → jSequence(B + ((i * linelength / frac1denom), 0), i, 1, frac1denom) → frac1intervalsSequence(C + ((i * linelength / frac2denom), 0), i, 1, frac2denom) → frac2intervalsSegment(B, B + ((frac1num * linelength / frac1denom), 0)) → frac1segmentSegment(C, C + ((frac2num * linelength / frac2denom), 0)) → frac2segmentSegment(F, G) → kLine(H, f) → lPoint(l) → IPoint(l) → JCircle(I, circlesize) → eCircle(J, circlesize) → pIntersect(e, l, 2) → KIntersect(p, l, 2) → LSegment(I, K) → mSegment(J, L) → nSequence(Segment[Rotate[I, (i * angle1rotation), I], Rotate[K, (i * angle1rotation), I]], i, 1, frac1denom) → frac1wedgesSequence(Segment[Rotate[J, (i * angle2rotation), J], Rotate[L, (i * angle2rotation), J]], i, 1, frac2denom) → frac2wedgesCircleSector(I, K, Rotate[K, (frac1num * angle1rotation), I]) → frac1SectorCircleSector(J, L, Rotate[L, (frac2num * angle2rotation), J]) → frac2Sector
AI Drawing Prompt Reference
Draw two parallel horizontal segments as fraction bases; on each segment mark endpoints, use them as centers to draw circles of fixed radius, erect perpendicular lines through the endpoints to intersect the circles forming vertical segments, divide each horizontal segment into equal parts according to the denominator and highlight a length proportional to the numerator via sliders. Below, create another pair of circles on a second horizontal line, draw radii to the circle intersections, partition each circle into equal sectors by the denominator and highlight sectors corresponding to the numerator with sliders, then label the two fractions and show their comparison.
The prompt above was compiled from the original drawing commands and is for reference only.