
Coin Flipping Experiment
Loading the math board and drawing, please wait…
In collections
probability
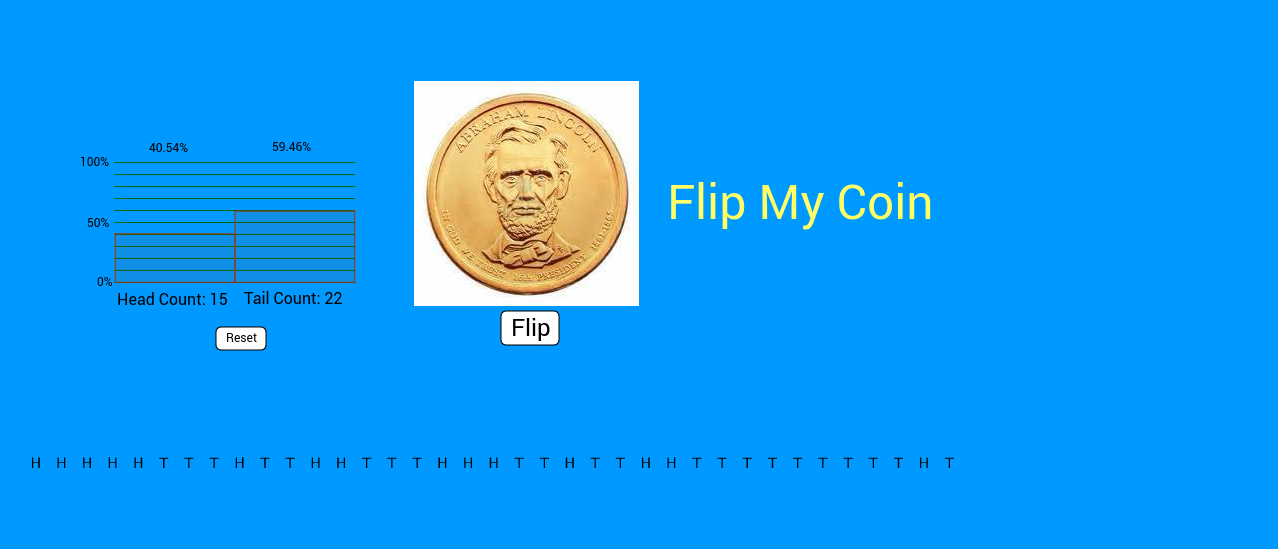
This is a math example of a coin flipping experiment, demonstrating basic probability concepts. By using GeoGebra commands, it generates the results of coin flips and counts the occurrences of heads and tails. The example covers core concepts in probability and statistics, suitable for middle school and above students to learn the basics of probability.
GeoGebra Commands & Parameters
CountIf(x ≠ 0, Trials) → clickCountIf(x ≟ "H", Trials) → headCountIf(x ≟ "T", Trials) → tailIf(click > 0, click, 1) → clickadjustBarChart(-0.5, 1.5, {CountIf[x ≟ "H", Trials] / clickadjust, CountIf[x ≟ "T", Trials] / clickadjust}) → bTableText({Trials}) → text3Sequence(Segment[(-0.5, i), (1.5, i)], i, 0, 1, 0.1) → list1
AI Drawing Prompt Reference
Create a statistical chart for a coin flipping experiment, showing the counts of heads and tails. First, create a slider to control the number of flips, then count the occurrences of heads and tails based on the flips, and display the ratio of heads and tails using a bar chart. Finally, show the total number of flips.
The prompt above was compiled from the original drawing commands and is for reference only.