
Circles in 3D Space by Patrick Clément
Loading the math board and drawing, please wait…
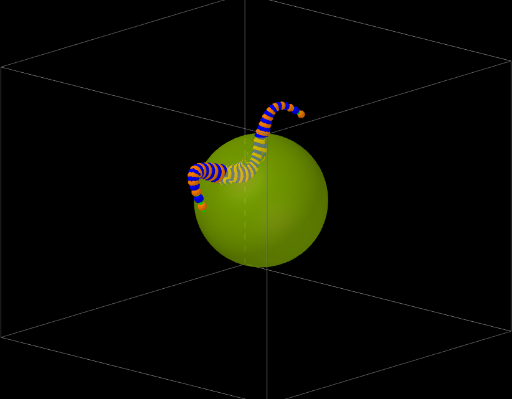
This example demonstrates circles in 3D space. It involves core concepts of solid and coordinate geometry. Using GeoGebra commands such as CurveCartesian, Point, Length, Sequence, etc., it constructs circles in 3D space. Suitable for high school math education and students learning 3D geometry.
GeoGebra Commands & Parameters
CurveCartesian((((a + (e * sin((d * t)))) * cos((b * t))) * cos(t)), (((a + (e * sin((d * t)))) * cos((b * t))) * sin(t)), ((a + (e * sin((d * t)))) * sin((b * t))), t, 0, 6.28319) → trajPoint(traj, p) → APoint(traj, p + k - floor(p + k)) → BPoint(traj, p + (7 * k) - floor(p + (7 * k))) → HPoint(traj, p + (3 * k) - floor(p + (3 * k))) → DPoint(traj, p + (2 * k) - floor(p + (2 * k))) → CPoint(traj, p + (4 * k) - floor(p + (4 * k))) → EPoint(traj, p + (5 * k) - floor(p + (5 * k))) → FPoint(traj, p + (6 * k) - floor(p + (6 * k))) → GLength(P) → lpSequence((i, x(Element[P, i])), i, 1, lp) → PxFitPoly(Px, deg) → fxSequence((i, y(Element[P, i])), i, 1, lp) → PyFitPoly(Py, deg) → fySequence((i, z(Element[P, i])), i, 1, lp) → PzFitPoly(Pz, deg) → fzCurveCartesian(fx(t), fy(t), fz(t), t, 1, Length[P]) → sqSequence((fx(i), fy(i), fz(i)), i, 1, lp, lp / n) → LPSequence(Segment[Element[LP, i], Element[LP, i + 1]], i, 1, n) → LSSphere((0, 0, 0), a) → sphSequence(Circle[Element[LP, i], (r * (1 - cos(((i * cf) * π / n)))), Element[LS, i]], i, 1, n, 2) → LCSequence(Circle[Element[LP, i], (r * (1 - cos(((i * cf) * π / n)))), Element[LS, i]], i, 2, n, 2) → LC'
AI Drawing Prompt Reference
Draw a 3D circular graph. The graph consists of multiple circles distributed at different heights. The construction order is to first create a 3D trajectory, then generate points as circle centers. Next, calculate the lengths of these points and use polynomial fitting to convert points into curves. Finally, fit the curves to circles and draw these circles.
The prompt above was compiled from the original drawing commands and is for reference only.