
Circle, Tangent and Function Graph Construction Example
Loading the math board and drawing, please wait…
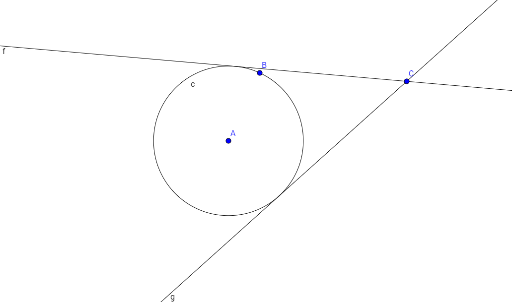
This GeoGebra example demonstrates the construction of a circle c and its tangent lines using points A, B, and C, together with function graphs f and g, to illustrate the geometric relationships among circles, tangents, and function curves in a coordinate plane. The core mathematical concepts covered include circle equations, tangent line properties, function graphs (potentially exponential functions), point-circle positional relationships, and analytic geometry construction. The construction uses the GeoGebra Circle command to create circle c and the Tangent command to draw tangents, involving objects A, B, C, c, f, and g. It is suitable for high school mathematics instruction, classroom demonstrations, and integrated practice in analytic geometry and function graphing.
GeoGebra Commands & Parameters
Circle(A, B) → cTangent(C, c) → f, g
AI Drawing Prompt Reference
Please draw a geometric figure that includes a circle and tangents. First, construct a circle using two points. Then, from another point outside the circle, draw two tangent lines to the circle. Finally, plot two function curves on the same coordinate plane to illustrate the geometric relationships among the circle, tangents, and function graphs.
The prompt above was compiled from the original drawing commands and is for reference only.